A coarse-grained parallel approach for seismic damage simulations of urban areas based on refined models and GPU/CPU cooperative computing

X.Z. Lu, [*] , B. Han, M. Hori, C. Xiong, and Z. Xu

a Key Laboratory of Civil Engineering Safety and Durability of China Education Ministry, Department of Civil Engineering, Tsinghua University, Beijing, P.R. China, 100084.

b Earthquake Research Institute, University of Tokyo, Bunkyo-Ku, Tokyo 113-0032, Japan.

Advances in Engineering Software, 2014, 70: 90-103.

Download Full Text

Abstract: Refined models and nonlinear time-history analysis have been important developments in the field of urban regional seismic damage simulation. However, the application of refined models has been limited because of their high computational cost if they are implemented on traditional central processing unit (CPU) platforms. In recent years, graphics processing unit (GPU) technology has been developed and applied rapidly because of its powerful parallel computing capability and low cost. Hence, a coarse-grained parallel approach for seismic damage simulations of urban areas based on refined models and GPU/CPU cooperative computing is proposed. The buildings are modeled using a multi-story concentrated-mass shear (MCS) model, and their seismic responses are simulated using nonlinear time-history analysis. The benchmark cases demonstrate the performance-to-price ratio of the proposed approach can be 39 times as great as that of a traditional CPU approach. Finally, a seismic damage simulation of a medium-sized urban area is implemented to demonstrate the capacity and advantages of the proposed method.

Keywords: Urban regional seismic damage simulation; Graphics processing unit; Refined model; Parallel computing

DOI: 10.1016/j.advengsoft.2014.01.010

If you need the PDF version of this paper, please email to luxinzheng@sina.com

1. Introduction

In recent years, very severe earthquakes, such as the 2008 Wenchuan earthquake, the 2010 Haiti earthquake, and the 2011 Tohoku earthquake, have occurred throughout the world. Each of these earthquakes caused more than 10,000 casualties and great financial losses in urban areas [1每3] . Thus, seismic damage simulations of urban areas are extremely important for predicting earthquake-induced damage and losses of potential seismic risks.

Several methodologies to simulate seismic damage in urban areas have been proposed. Damage estimation methods that use probability matrices have been the most widely used methods in the past 30 years [4] . Traditional methods that use probability matrices are primarily based on the modified Mercalli intensity, and the vulnerability data of buildings is primarily obtained from historical data regarding earthquake damage [5] . An alternative method based on the response spectrum parameters of scenario-based ground motions was proposed and adopted in the loss estimation software HAZUS 97 [6] , and it was improved to yield the Advanced Engineering Building Modules (AEBM), which were adopted in HAZUS 99-SR2 [7] . In this method, the structural damage is determined according to the intersection of the capacity curve of the building and the demand spectra of the earthquake. In Japan, a similar approach has also been used [8] . However, some problems still exist in these methods. In the AEBM method, the influence of higher-order vibration modes is difficult to be taken into account, because the capacity curve of the building is primarily based on first-mode pushover analysis. Although theoretically multiple-mode pushover analysis is able to consider the contribution of higher modes, it is relatively difficult to implement and therefore in current AEBM method such method is not adopted. The local damage in different stories cannot be explicitly obtained. Moreover, the influence of some characteristics of ground motions, such as different durations or velocity pulses [9] , cannot be calculated precisely.

To overcome these problems, two major improvements have been adopted in recent studies. Refined models (e.g., finite element model or discrete element model) of buildings have been adopted to provide a better approach to consider the dynamic characteristics of buildings [10] , and comparing to the static analysis (e.g., AEBM method), nonlinear time-history analysis (THA) has been adopted to fully consider the features of ground motions (e.g., duration time, amplitude and frequency characteristic) [11] . Refined models and nonlinear THA are widely adopted for individual buildings [12] , but it is difficult to use these methods for urban areas that have numerous buildings. An important cutting-edge advancement of using nonlinear THA and refined models for urban regions, named ※integrated earthquake simulation (IES)§, was proposed by Hori and Ichimura [13] . It incorporates both ground-motion simulation and structural response analysis. Currently, a series of refined seismic response analysis models, such as the discrete element model and the fiber element model, are adopted in IES [14] . The GIS Database is used to obtain the parameters of the buildings that are used in IES. Several applications of IES for urban areas are implemented [13] . However, the computing platform is an important constraint of IES. A very powerful computer platform is necessary when the results must be obtained in a very limited time (e.g., for some emergency response purpose) [15] . For a large urban region, only supercomputer systems can meet the requirements, which demand a very high maintenance cost. Another challenge of this method is that when the discrete element model or the fiber element model is adopted, very detailed information of buildings is required (e.g., material properties, reinforcement layouts), which is very difficult to obtain for large urban areas. Thus, it is difficult to use such systems widely.

In recent years, the rapid development of graphics processing unit (GPU) technology has resulted in a new vision for general-purpose computation. Although the performance of a single core of a GPU is relatively weak, there are many more cores on a GPU than on a CPU, which leads to a much higher computing performance for a GPU than for a CPU of a similar price [16] . The programming difficulty of GPU general-purpose computation was significantly reduced after NVIDIA Corporation developed its Compute Unified Device Architecture (CUDA). Now, GPU computing plays an increasingly important role in biology, electromagnetism, geography, particle contact detection, and other fields [17每20] .

Despite its advantages, GPUs are not perfect for all problems. For a parallelizable computing task, the most appropriate architecture of a GPU program should be based on fine-grained parallelism [21] , which means that each subtask is divided into many operations and the implementation of the operations is parallelized. This type of parallelism is widely used in neural networks and finite element analysis [22, 23] . Carefully tuned algorithms are needed to manage large quantities of fine-grained parallelism on GPU platforms. In contrast, coarse-grained parallelism provides a much easier way to take advantage of GPUs. In coarse-grained parallelism, the parallelization is implemented for subtasks instead of operations. It is also implemented in analysis, optimization, and control [24] . The performance of coarse-grained parallelism can be as high as that of fine-grained parallelism when it is implemented for tasks with the following features:

(1) The quantity of subtasks is much greater than the number of cores on a GPU.

(2) Each subtask has a moderate computing workload and can be individually implemented on a single GPU core.

(3) The data exchange between different subtasks is limited, and no global synchronization is required.

Fortunately, urban regional seismic damage simulations have all of these features. Although there are thousands of buildings in an urban area, if each building is treated as a subtask and a proper computing model is adopted, the computing workload of each subtask is sufficiently small to be performed on a single GPU core. Furthermore, because interactions between buildings (e.g., pounding ) are limited and cannot be tracked at a large scale during an earthquake, the effect of them can be ignored in the simulation for large urban areas, which results in little data exchange between different GPU cores. Because there are hundreds of cores in a GPU and each GPU core can be used for the simulation of one building, only several task assignment rounds are required to complete the simulation of a city with thousands of buildings using GPU computing. Thus, the computational efficiency should be very high. Compared with fine-grained parallelism, coarse-grained parallelism-based regional seismic damage simulation is more flexible because it can account for different building computational models and different city sizes, and poses fewer programming difficulties. Hence, coarse-grained parallelism is adopted in this work.

In this study, a parallel computing approach for seismic damage simulations of urban areas based on refined models and nonlinear THA is introduced. NVIDIA GPUs and the CUDA language are selected as the parallel platform for nonlinear THA because they provide a ※high efficiency每low cost§ platform for general computing. However, the function of CPUs for logical computations and task assignments is irreplaceable. For urban regional seismic damage simulations, there is substantial work in addition to the nonlinear THA. Therefore, a GPU/CPU cooperative computing method is introduced because it can take full advantage of both platforms. Benchmark cases and a medium-sized city example are presented to demonstrate the advantages of the proposed method.

2. Program architecture

2.1. Architecture of the entire program

Three modules are involved in the program: the Pre-analysis Module, the Seismic Analysis Module, and the Post-analysis Module. Figure 1 shows the global flow chart of the program. The Seismic Analysis Module is the kernel part used for implementing the nonlinear THA and will be introduced in detail in Section 2.2.

2.1.1. Pre-analysis Module

The primary purpose of the Pre-analysis Module is to obtain the parameters of the computational model for buildings and to choose the earthquake scenario for the nonlinear THA. The GIS database is the main data source of the program, including the macro-scale data of buildings (e.g., structural types, numbers of stories, heights, areas, and locations), which are used to determine the parameters of the computational model, and regional properties (the site category and the distance to the fault rupture plane), which are the basis for the earthquake scenario selection.

Different ground motions may have a certain influence on simulation results. However, because many regional ground motion generation and selection methods have been proposed [25每29] and this work is focused on the modeling of regional buildings, the regional ground motion generation is not discussed in this study.

2.1.2. Post-analysis Module

Three-dimensional virtual scene display technology is used in the Post-analysis Module to show the maximum inter-story drift and the maximum floor acceleration values that are obtained from the Seismic Analysis Module.

2.2. Seismic Analysis Module

The Seismic Analysis Module is the kernel numerical computing module of the program. The nonlinear THA to obtain the damage states and seismic responses for each building is implemented in this module. The nonlinear THA is based on CPU/GPU cooperative computing; thus, its architecture must be carefully designed to best utilize the high performance of GPUs. The key principles of the architecture are as follows.

(1) The CPU is used for data reading and the assignment of computing tasks because of its powerful logical computing capacity.

(2) The GPU is used for the damage simulation of individual buildings because of its powerful parallel computing capacity.

(3) Communication between the CPU and GPU is reduced to prevent communication delays.

Figure 2 shows the flow chart of the Seismic Analysis Module, the details of which are provided below.

CPU computing tasks

(1) Read the ground motion and building data, and store them in the host memory.

(2) Allocate the space in the host memory and the global graphics memory for the data exchange between the CPU and GPU.

(3) Copy the data (i.e., ground motion data, building data, and simulation results) between the two memories.

(4) Invoke the global function in CUDA to call the GPU for calculations and manage the GPU resources.

(5) Output results.

GPU computing tasks

(1) Allocate space in the graphics memory for temporary data.

(2) Read the data for each building, perform a nonlinear THA for the building, and write the results to the graphics memory that has been allocated by the CPU for data exchange.

CPU每GPU communication mode

(1) Define the parameters of GPU, such as the number of grids, blocks, and threads, in the main function running on the CPU.

(2) Use ※cudaMemcpy()§ function provided by CUDA to copy data between the CPU and GPU.

2.3. Computational Models and Methods

Many computational models have been developed to perform nonlinear THA, ranging from the simplest SDOF model to the significantly more complicated solid-element model [30每32] . In this study, to balance the requirements of workload and accuracy, the multi-story concentrated-mass shear (MCS) model is selected (as shown in Figures 3 and 4). The masses of the buildings are concentrated into their corresponding stories, and the nonlinear behavior of the structure is represented by the inter-story hysteretic deformation. Because most of the buildings are mid-rise or low-rise buildings in the investigated urban area and this study primarily focuses on the computational efficiency, the MCS model is appropriate for this work. The accuracy of the MCS model is primarily controlled by the model for the inter-story hysteretic behavior. Many studies regarding the inter-story hysteretic behavior of the MCS model have been conducted [33每36] . An inter-story hysteretic model based on the widely used HAZUS program [37] is adopted in this case and is described in Appendix A. Note that only few parameters of buildings are required to determine the inter-story hysteretic model of HAZUS program (e.g., structural types, height, construction period etc.), which are available from the GIS database conveniently. Therefore, the proposed MCS model is suitable for damage simulation of large urban areas. Besides, if the detailed structural information of a building is available, such detailed information can also be fully represented by the proposed MCS model, which will improve the accuracy of the prediction. This is also an important advantage of the MCS model. Note also that this research primarily focuses on the efficiency and the accuracy of CPU/GPU cooperative computing, so the reliability of the performance data of buildings will not be further discussed. Other models could be adopted instead of the inter-story hysteretic model described in Appendix A, but the conclusions of this study would be unchanged.

To avoid the convergence problem of implicit dynamic computing, the central difference method [38] is used to solve the equations of motion. Classical Rayleigh damping is used for the damping matrix and the damping ratios for different types of buildings are presented in Table A2 of Appendix A.

3. Performance Benchmark

To benchmark the performance of the Seismic Analysis Module, a similar program based solely on a CPU platform is also developed. A performance comparison between the GPU/CPU cooperative program and the CPU program is presented below.

3.1. Benchmark case

(1) 1,024 Moderate-Code buildings with equal-probability randomly generated structure types and numbers of stories, as shown in Table 1, are used.

(2) The well-known El Centro record of the Imperial Valley, California, earthquake of May 18, 1940 [39] is selected as the ground motion for the benchmark. Note that this is only a sample ground motion for the benchmark. Since the nonlinear dynamic response of a structure is strongly dependent on the characteristics of the earthquake input, the ground motion should be selected according to the authentic method in practical applications.

(3) The peak ground acceleration (PGA) is normalized to 200 cm/s2. More than half of the buildings will step into nonlinear states with this level of PGA. Because the central difference method [38] is used in this approach, the computational time won*t change significantly with different levels of PGA.

(4) The duration of time history analysis and number of time steps are 40 s and 8,000 steps, respectively.

(5) To prevent the bottleneck effect caused by the hard disk*s reading and writing speed, the time of data input and output is not included in the computational time.

3.2. Platforms

CPU platform

Hardware: A 2.93-GHz Intel Core i3 530 processor with 4 GB of 1333-MHz DDR3 RAM.

Compiler: Microsoft Visual C++ 2008 SP1.

GPU/CPU cooperative platform

Hardware: A 2.4-GHz Intel Celeron E3200 CPU & an NVIDIA GeForce GTX 460 with 1 GB graphics memory.

Compiler: Microsoft Visual C++ 2008 SP1 & CUDA 4.2.

The hardware of the two platforms was similarly priced in 2011 (approximately 150 US dollars); thus, they can be used to compare their performance-to-price ratio. Only one CPU core is used in this benchmark.

3.3. Results of the benchmark

First, the nonlinear THA for each building is implemented one by one on both the CPU and GPU/CPU cooperative platform to obtain the computational time for one building. The relationship between the number of stories and average computing time for one building is shown in Figure 5. The GPU/CPU cooperative computing time is much longer than that of the CPU because the computing capability of a single GPU core is relatively weaker than that of a CPU core. For a 10-story building, the computing time of the GPU/CPU cooperative platform is approximately 5 seconds when single precision is used, whereas it increases to 8 seconds when double precision is adopted. In contrast, the computational time for single precision and double precision is very similar on the CPU platform (in fact, double precision is slightly faster). This effect occurs because the aforementioned CPU is based on a 64-bit architecture, for which the default computing precision is double precision. A conversion is required for single-precision float computing; this conversion costs additional time.

Next, a benchmark for the block size (i.e., the number of threads in a block) of CUDA in the GPU/CPU cooperative computing program is implemented for the 1,024 buildings (as shown in Figure 6). The peak performance of the program is achieved when the block size is equal to 32. The primary factor that causes lower performance when the block size is less than 32 is the computing architecture of CUDA. When using CUDA for parallel computing, every set of 32 threads in the same block constitutes a ※warp§, and the computing tasks can only be assigned warp-by-warp [40] . Therefore, some of the computing capability is wasted when the block size is less than 32 [41] .  In contrast, the maximum number of registers available per block is another bottleneck of the performance. Registers are the fastest memory in the GPU that have sufficiently high bandwidth and low latency to obtain the peak performance of the GPU [41] . In this coarse-grained parallel program, there are many private variables in each kernel, which implies that when more registers are used in one kernel, a higher performance is obtained. In the GPU used in this benchmark, there are 32K 32-bit registers (i.e., 32,768 single-precision floats or 16,384 double-precision floats) available for one block, and the maximum number of registers that can be used by a thread is 63 [40] . Thus, if the block size is greater than 520 in single precision (or 260 in double precision), the available registers for a thread will decrease, thereby yielding lower performance for the parallel computation, as shown in Figure 6.

Weak-scaling benchmarks for the two platforms are implemented (the block size for the GPU/CPU cooperative computing is 32). The buildings are randomly selected from the 1,024 buildings. The relationship between the number of buildings and computing time is compared, and the results are shown in Figure 7. The shape of the curve for the CPU program is approximately linear, which indicates that the computational time is proportional to the number of buildings. This result is consistent with serial computing theory, the concept of which is ※single thread, single task§. In contrast, for the GPU/CPU cooperative computing, the total computing time is primarily determined by the longest computing thread (compared in Figure 7). It is demonstrated that the arithmetic latency between different threads can be well hidden by the parallel computation. There are small jumps on the GPU/CPU cooperative double-precision curve, which occur because double-precision float computing on the GTX460 is implemented on the Special Function Unit (SFM), whose number is 1/6 of the CUDA cores. Hence, the latency cannot be hidden as well as for single precision. However, this effect will disappear on the Tesla GPU, which is based on Fermi architecture, because the double-precision float computing is implemented directly on the CUDA cores [40] .

Comparing the GPU/CPU cooperative and CPU computing times indicates that the GPU is perfect for extensive parallel nonlinear THA, as shown in Figure 8. When 1,024 buildings are computed, the GPU/CPU cooperative computation time is approximately 1/39 times the CPU computational time when single precision is used. This ratio increases to 1/21 when double precision is used.

Tables 2 and 3 present the CPU and GPU/CPU cooperative computation results for a five-story steel moment frame building. The error between the maximum inter-story drift calculated using single precision and that using double precision is less than 0.1% on both the CPU platform and the GPU/CPU cooperative platform, which is in an acceptable error level for regional seismic damage simulations.

The conclusions of the benchmark are as follows:

(1) For this coarse-grained GPU/CPU cooperative program, the block size of CUDA is recommended to be 32 to obtain the highest performance because the arithmetic latency can be well hidden and the maximum number of registers can be used at this size.

(2) The performance of the GPU/CPU cooperative computing program can be as much as 39 times that of the CPU program (run on 1 core), which demonstrates the high performance-to-price ratio of GPUs for urban seismic damage simulations. If more buildings are computed (e.g., more than 100,000, which is typical for real large cities) and more earthquake scenarios are used, the computational time of the GPU/CPU cooperative program can be several hours or days shorter than that of the CPU program.

(3) The computational time of the GPU/CPU cooperative program using double precision is 67% longer than that using single precision, but the computational error caused by using single precision is very small and acceptable for regional seismic damage simulations. However, more graphics memory is required for double precision than for single precision. Thus, single precision is recommended in this study for a balance of efficiency and accuracy.

4. Application

As an example, seismic damage simulations of a medium-sized urban area in China are implemented using the proposed approach.

4.1. General information

There are 4,255 buildings in the medium-sized urban area under study. The seismic design levels of the buildings in the urban area are shown in Table 4 according to the construction period [42] , which is used to determine the corresponding parameters in the inter-story hysteretic behavior based on the model proposed by HAZUS [37] . The number of buildings of each structural type and seismic design level are presented in Table 5. Figure 9 shows the 3D building models of the urban area.

Three groups of ground motion records are selected as the earthquake scenarios: far-field, near-field without pulses, and near-field with pulses. For each group, 5 scenario records are selected from the corresponding ground motion sets recommended by FEMA P695 [25] , as shown in Table 6. Three levels of PGA are adopted: 70, 200, and 400 cm/s2, which correspond to earthquakes with 63%, 10%, and 2% probabilities of exceedance in 50 years, respectively [43] . The influence of different sites is not considered, and the ground motion inputted to all the buildings is identical. Of course, in real situations, the inputted ground motion will be different for various buildings because of different site conditions and site-fault distances [28] . However, because this study is focused on the simulation of regional buildings, the influence of different ground motions at different sites will not be discussed.

To demonstrate the advantages of the proposed method, seismic damage simulations using both the proposed approach and the method based on the single-degree-of-freedom (SDOF) model are performed. The parameters of the SDOF model are determined using a method similar to that proposed by Steelman & Hajjar [30] .

4.2. Results

The statistical results for the maximum story damage states are shown in Figure 10. Note that the maximum story damage of the MCS model is a little greater than that of the SDOF model in most cases. This difference is reasonable because the damage of the SDOF model represents the overall damage of the buildings, whereas the MCS model can consider the mechanism of damage concentration in soft stories. The difference of the damage states between the two models is not very significant for far-field records and near-field records without pulses. However, a significant difference is found for near-fields with pulses. The damage states of the MCS model are much greater than those of the SDOF model when the PGA is equal to 200 cm/s2. Such velocity pulses can induce serious damage to buildings because of high-order vibration, which can be considered by the MCS model but cannot be considered by the SDOF model.

Examples of damage states using the proposed MCS model and the SDOF model are compared in Figure 11 (record: IMPVALL/H-E06_233, PGA: 200 cm/s2). It is shown that with the proposed MCS model, the damage locations on various stories can be obtained, which are significant for loss estimation. Furthermore, the peak acceleration of each story can be obtained with the proposed MCS model comparing to the SDOF model, as shown in Figure 12.

5. Conclusions

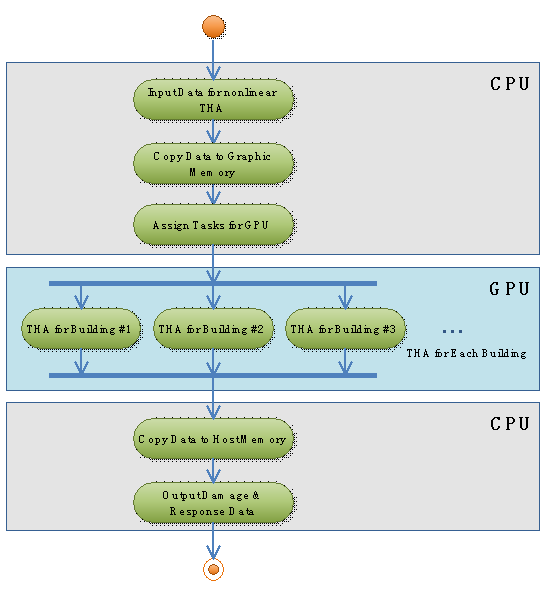
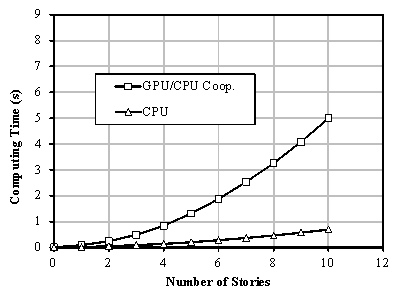
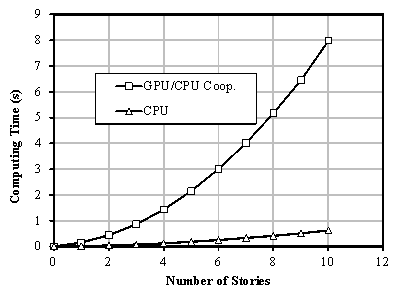
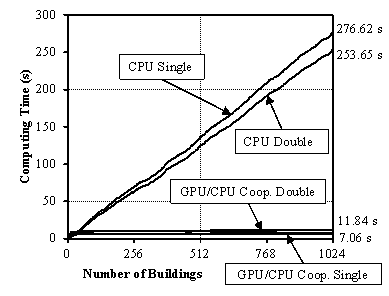
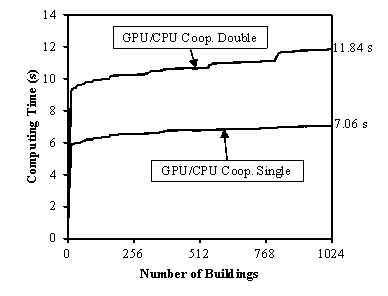
It has been demonstrated that the performance of the proposed approach for seismic damage simulations of urban regions based on GPU/CPU cooperative computing is very high. The performance-to-price ratio can be 39 times as great as that of a traditional CPU approach, leading to a very significant difference in computing time for seismic simulations for real large cities.

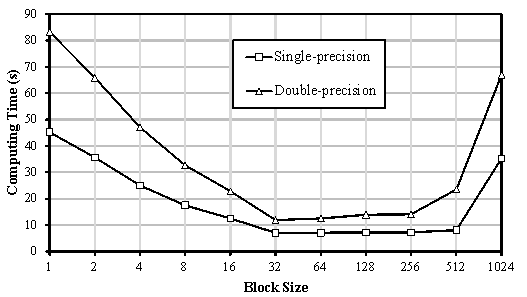
According to the benchmark, single-precision float computing is recommended in this approach because of the higher performance and lower memory required compared with when double precision is used. The accuracy requirements of urban seismic damage simulations can be satisfied by both single precision and double precision.

The influence of velocity pulses can be considered in the proposed approach. Furthermore, the damage locations, which are greatly significant to loss estimation, can also be obtained using the proposed MCS model.

It should be noted that this work is the first trial to implement the regional seismic damage analysis based on GPU/CPU cooperative computing, and significant progress has been obtained. Further improvements, such as more accurate inter-story hysteretic behavior for the MCS model and more rational soil/site models, will increase the accuracy of the prediction. All these improvements can be implemented on the proposed program architecture, which indicates the significant potential of the proposed method.

Appendix A. Inter-story model of regular buildings

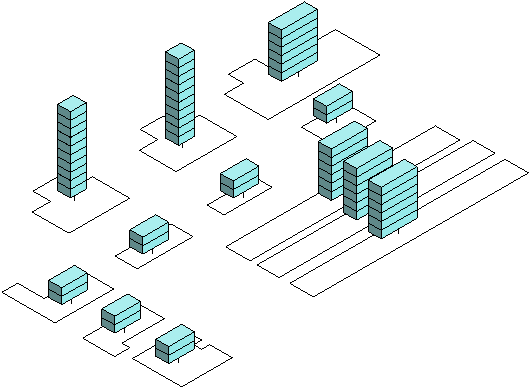
The buildings in an urban region are divided into different groups according to their structural types and heights. For regular buildings, the 19 building types proposed in HAZUS [7] are adopted, as shown in Table A1. For some special buildings, for which the performance is quite different from that of regular buildings, the inter-story behavior can be determined using a detailed structural analysis, as demonstrated in Appendix B.

A.1. Inter-story hysteretic model

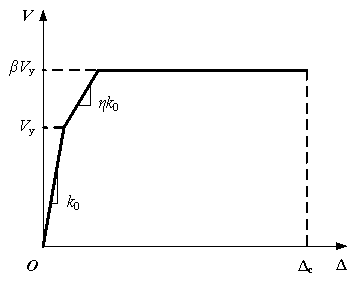
The trilinear backbone curve proposed by HAZUS [37] is adopted in this study to describe the backbone curve of the inter-story behavior (as shown in Figure A1), which represents the elastic, yielding, and fully plastic stages. There are 5 parameters in the backbone curve: K0 (the initial lateral stiffness), Vy (the inter-story shear yield strength), (the hardening ratio), (the ratio of peak strength to yield strength), and 忖c (the inter-story drift of the complete damage state, which determines the collapse state of the story).

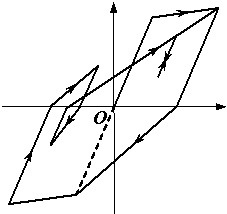
Three different inter-story hysteretic models are adopted in this study according to the structural types of the buildings. The widely used Modified-Clough model [44] , shown in Figure A2a, is capable of modeling reinforced concrete frames that fail because of flexural failure [45每47] . Thus, this model is selected in this research to represent the concrete frame structures (i.e., C1 in Table A1).

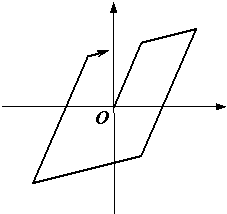
Another commonly used model is the bilinear elasto-plastic model (Figure A2b), which can be used to represent conventional steel moment frames [46, 48] . Thus, this model is also used here to model steel frames (i.e., S1 and S3 in Table A1).

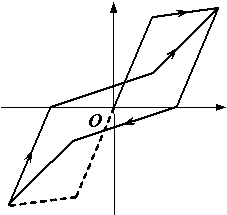
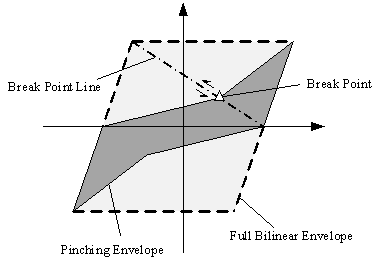
For those structures in which shear failure is most significant, a pinching model (Figure A2c) is an appropriate choice for the simulation [49每51] . The commonly used pinching model proposed by Steelman & Hajjar [30] is adopted in this study. In this model, the unloading stiffness is constant and equal to the initial stiffness. All possible break points in the reloading curve are located on the straight ※break point line§ from the intersection of the unloading path with the horizontal axis to the yield point of the full bilinear hysteretic loop in the loading, as shown in Figure A3. Thus, only one parameter, , is required to determine the hysteretic behavior of the model, as shown in Eq. (A.1)

                                                                     ,                                                            (A.1)

in which Ap and Ab are the areas of the pinching envelope and full bilinear envelope, respectively (Figure A3). is a coefficient used to quantify the severity of degradation. The reason for choosing this model is that the pinching parameter can be easily determined by the degradation factor given in Table 5.18 of HAZUS [30, 37] . If another pinching model (e.g., the Ibarra pinching model [52] ) is adopted, the calibration of various parameters is very difficult and ineffective for regional seismic analysis. This model is adopted for all the structural types in this research except C1, S1 and S3.

A.2. Parameters for the inter-story hysteretic model

For most buildings in urban areas, the first and second modes primarily determine the seismic response [38] . The periods of the buildings are determined using Eq. (A.2) [28, 53] :

                                                                 ,                                                       (A.2a)

                                                                   ,                                                         (A.2b)

where T1 and T2 are the first and second vibration periods of the specific building, respectively, N is the number of stories of the specific building. N0 and T0 are the number of stories and fundamental period, respectively, of the typical buildings presented in Tables 5.5 and 5.7 of FEMA [37] .

For regular buildings, the initial inter-story stiffness and the mass of each story are uniformly distributed along the height of the building [28] ; then, the stiffness and mass matrices of the MCS model are:

                                         ,                                 (A.3)

                                               .                                       (A.4)

Hence, the natural frequency of the fundamental mode is [38] :

                                       ,                              (A.5)

where [1] is the modal vector of the fundamental mode. If [K] and [M] are determined, [1] can be easily determined using a generalized eigenproblem analysis [38] . For a building with uniform mass and lateral stiffness in each story, [朴1] will not change with k0 or m, so [朴1] can be determined with assumed k0 and m.

Therefore, the initial inter-story shear stiffness is:

                        ,                (A.6)

where:

                                                          ,                                                 (A.7)

Thus, the inter-story backbone curve parameters of story i in Figure A1 are determined as follows:

                                                              ,                                                   (A.8a)

                                                      ,                                           (A.8b)

                                                         ,                                              (A.8c)

                                                                   ,                                                        (A.8d)

                                                                ,                                                      (A.8e)

where m is the mass of each story, which is determined based on the area of the floor and the function of the building [15] . g is the acceleration of gravity.  is the inter-story drift ratio at the threshold of the complete damage state, which is suggested by HAZUS [37] . h is the story height. (SDy, SAy), (SDu, SAu) are the yield capacity point and the ultimate capacity point, respectively, of the capacity curve suggested by HAZUS [37] , which is a function of the design intensity and constructional period.  is the mode factor suggested by HAZUS [37] .  is the ratio between the inter-story shear strength of the ith story ( ) and that of the ground story ( ), which is calculated as follows:

                                                                    .                                                           (A.9)

The relationship between the design seismic load of the story and the altitude of the story above ground level is approximately linear in Chinese building codes [43] . Futhermore, the design inter-story shear strengths of the story and the sum of lateral load of the above stories can also be considered as linear relationship. Thus,  can be expressed as:

                                                   .                                         (A.10)

in which  and  are the weights of stories j and k, respectively.  and  are the altitudes of stories j and k above ground level, respectively. A similar method is also used by other researchers [54] .

The empirical values of the damping ratio for Rayleigh damping [38] are estimated according to the structural type of the building, as given in Table A2.

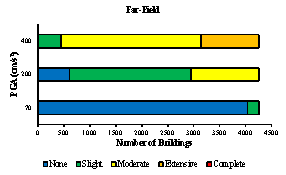
The damage states for regular buildings are identical to the damage states defined by HAZUS: slight, moderate, extensive, and complete. The inter-story drift ratio is adopted as the threshold of each structural damage state, and the values for the 19 structural types are based on Table 5.9 of HAZUS [37] .

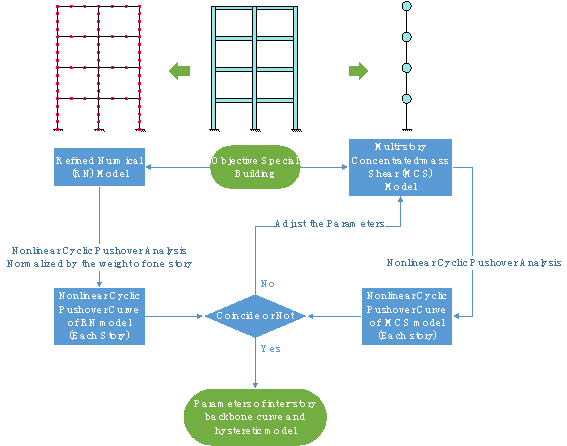
Appendix B. Inter-story model for special buildings

Parameters of the inter-story backbone curve and hysteretic model for special buildings are obtained using pushover analysis. Figure B1 presents the process of the method. The pushover analysis can be implemented using more detailed numerical models (such as the fiber beam element model or the multi-layer shell model [31, 55每57] ) according to the structural design data.

Acknowledgements

The authors are grateful for the financial support received from the National Key Technology R&D Program (No. 2013BAJ08B02) and the National Nature Science Foundation of China (No. 51222804, 51178249, 51308321).

References

[1] Ye LP, Lu XZ, Li Y. Design objectives and collapse prevention for building structures in mega-earthquake. Earthq Eng Eng Vib. 2010;9:189每99.

[2] Bilham R. Lessons from the Haiti earthquake: Roger Bilham, one of the first seismologists to visit Haiti after last month's earthquake, calls for UN enforcement of resistant construction in cities with a history of violent tremors. Nature. 2010;463:878每9.

[3] Hasegawa A, Yoshida K, Asano Y, Okada T, Iinuma T, Ito Y, et al. Change in stress field after the 2011 great Tohoku-Oki earthquake. Earth Planet Sci Lett. 2012;355每356:231每43.

[4] Onur T, Ventura CE, Finn WDL. A comparison of two regional seismic damage estimation methodologies. Can J Civ Eng. 2006;33:1401每9.

[5] Applied Technology Council (ATC). Earthquake damage evaluation data for California. ATC-13. Redwood City, California, USA; 1985.

[6] Federal Emergency Management Agency (FEMA) 每 National Institute of Building Sciences (NIBS). Earthquake loss estimation methodology 〞 HAZUS97, Technical manual. Washington DC; 1997.

[7] Federal Emergency Management Agency (FEMA). Multi-hazard loss estimation methodology HAZUS 每 MH 2.1 Advanced Engineering Building Module (AEBM) technical and user's manual. Washington DC; 2012.

[8] Sextos AG, Kappos AJ, Stylianidis KC. Computer-aided pre- and post-earthquake assessment of buildings involving database compilation, GIS visualization, and mobile data transmission. Comput-Aided Civil Infrastruct Eng. 2008;23:59每73.

[9] Iwan W. Drift spectrum: measure of demand for earthquake ground motions. J Struct Eng. 1997;123:397每404.

[10] Lu X, Lu XZ, Guan H, Ye LP. Collapse simulation of reinforced concrete high-rise building induced by extreme earthquakes. Earthq Eng Struct Dyn. 2013;42:705每23.

[11] Seyedi DM, Gehl P, Douglas J, Davenne L, Mezher N, Ghavamian S. Development of seismic fragility surfaces for reinforced concrete buildings by means of nonlinear time-history analysis. Earthq Eng Struct Dyn. 2010;39:91每108.

[12] Krawinkler H. Van Nuys Hotel building tested report: exercising seismic performance assessment. Pacific Earthquake Engineering Research (PEER) Center, Berkeley, California; 2005.

[13] Hori M, Ichimura T. Current state of integrated earthquake simulation for earthquake hazard and disaster. J Seismol. 2008;12:307每21.

[14] Wijerathne M, Hori M, Kabeyazawa T, Ichimura T. Strengthening of parallel computation performance of integrated earthquake simulation. J Comput Civil Eng.doi:10.1061/(ASCE)CP.1943-5487.0000235.

[15] Sobhaninejad G, Hori M, Kabeyasawa T. Enhancing integrated earthquake simulation with high performance computing. Adv Eng Softw. 2011;42:286每92.

[16] Owens JD, Luebke D, Govindaraju N, Harris M, Kr邦ger J, Lefohn AE, et al. A survey of general-purpose computation on graphics hardware. Comput Graph Forum. 2007;26:80每113.

[17] Stone JE, Phillips JC, Freddolino PL, Hardy DJ, Trabuco LG, Schulten K. Accelerating molecular modeling applications with graphics processors. J Comput Chem. 2007;28:2618每40.

[18] Weldon M, Maxwell L, Cyca D, Hughes M, Whelan C, Okoniewski M. A practical look at GPU-accelerated FDTD performance. Appl Comput Electromagn Soc J. 2010;25:315每22.

[19] Lv MH, Wei X, Lei C. A GPU-based parallel processing method for slope analysis in geographical computation. Adv Mater Res. 2012;538每541:625每31.

[20] Zheng J, An X, Huang M. GPU-based parallel algorithm for particle contact detection and its application in self-compacting concrete flow simulations. Comput Struct. 2012;112每113:193每204.

[21] Che S, Boyer M, Meng J, Tarjan D, Sheaffer JW, Skadron K. A performance study of general-purpose applications on graphics processors using CUDA. J Parallel Distr Com. 2008;68:1370每80.

[22] Hung SL, Adeli H. A parallel genetic/neural network learning algorithm for MIMD shared memory machines. IEEE Trans Neural Netw. 1994;5:900.

[23] Mackerle J. FEM and BEM parallel processing: theory and applications 每 a bibliography (1996-2002). Eng Comput. 2003;20:436每84.

[24] Adeli H. High-performance computing for large-scale analysis, optimization, and control. J Aerosp Eng. 2000;13:1每10.

[25] Federal Emergency Management Agency (FEMA). Quantification of building seismic performance factors. FEMA P695. Washington DC; 2009.

[26] Applied Technology Council (ATC). Quantification of building seismic performance factors. ATC-63. Redwood City, CA; 2008.

[27] American Society of Civil Engineers (ASCE). Minimum design loads for buildings and other structures (ASCE/SEI 7-05). Reston, Virginia; 2005.

[28] Hori M. Introduction to computational earthquake engineering. 2nd ed. London: Imperial College Press; 2011.

[29] Bradley BA. A generalized conditional intensity measure approach and holistic ground-motion selection. Earthq Eng Struct Dyn. 2010;39:1321每42.

[30] Steelman JS, Hajjar JF. Influence of inelastic seismic response modeling on regional loss estimation. Eng Struct. 2009;31:2976每87.

[31] Tang BX, Lu XZ, Ye LP, Shi W. Evaluation of collapse resistance of RC frame structures for Chinese schools in seismic design categories B and C. Earthq Eng Eng Vib. 2011;10:369每77.

[32] Yamashita T, Muneo H, Kajiwara K. Petascale computation for earthquake engineering. Comput Sci Eng. 2011;13:44每49.

[33] Veletsos AS, Vann WP. Response of ground-excited elastoplastic systems. J Struct Div. 1971;97:1257每81.

[34] Diaz O, Mendoza E, Esteva L. Seismic ductility demands predicted by alternate models of building frames. Earthq Spectra. 1994;10:465每87.

[35] Hajirasouliha I, Doostan A. A simplified model for seismic response prediction of concentrically braced frames. Adv Eng Softw. 2010;41:497每505.

[36] Rahman S, Grigoriu M. Local and models for nonlinear dynamic analysis of
multi-story shear buildings subject to earthquake loading. Comput Struct. 1994;53:739每54.

[37] Federal Emergency Management Agency (FEMA). Multi-hazard loss estimation methodology: earthquake model, HAZUS 每 MH 2.1 technical manual. Washington DC; 2012.

[38] Chopra AK. Dynamics of structures. New Jersey: Prentice Hall; 1995.

[39] Cundumi O, Su芍rez LE. Numerical investigation of a variable damping semiactive device for the mitigation of the seismic response of adjacent structures. Comput-Aided Civil Infrastruct Eng. 2008;23:291每308.

[40] NVIDIA. NVIDIA CUDA programming guide. 2012; URL: http://docs.nvidia.com/cuda/pdf/CUDA_C_Programming_Guide.pdf, Date Accessed: January 2013.

[41] Farber R. CUDA application design and development. San Francisco: Morgan Kaufmann; 2011.

[42] Lin SB, Xie LL, Gong MS, Li M. Performance-based methodology for assessing seismic vulnerability and capacity of buildings. Earthq Eng Eng Vib. 2010;9:157每65.

[43] Ministry of Construction of the People's Republic of China (MCPRC). Code for seismic design of buildings (GB 50011-2001). Beijing, China: China Architecture & Building Press; 2010.

[44] Mahin SA, Lin J. Construction of inelastic response spectra for single-degree-of-freedom systems, computer program and applications. UCB/EERC-83/17. University of California, Berkeley, California; 1983.

[45] Tong GS, Zhao YF. Seismic force modification factors for modified-Clough hysteretic model. Eng Struct. 2007;29:3053每70.

[46] Miranda E, Ruiz-Garcia J. Influence of stiffness degradation on strength demands of structures built on soft soil sites. Eng Struct. 2002;24:1271每81.

[47] Ruiz-Garcia J. Performance-based assessment of existing structures accounting for residual displacements [PhD]. Stanford, California: Stanford University; 2004.

[48] Peng L. Seismic response evaluation of self-centering structural systems [PhD]. Stanford, California: Stanford University; 2005.

[49] Kinali K, Ellingwood BR. Seismic fragility assessment of steel frames for consequence-based engineering: a case study for Memphis, TN. Eng Struct. 2007;29:1115每27.

[50] Hidalgo PA, Jordan RM, Martinez MP. An analytical model to predict the inelastic seismic behavior of shear-wall, reinforced concrete structures. Eng Struct. 2002;24:85每98.

[51] Voon KC. In-plane seismic design of concrete masonry structures [PhD]. New Zealand: University of Auckland; 2007.

[52] Ibarra LF, Medina RA, Krawinkler H. Hysteretic models that incorporate strength and stiffness deterioration. Earthq Eng Struct Dyn. 2005;34:1489每511.

[53] Ministry of Construction of the People's Republic of China (MCPRC). Load code for the design of building structure (GB 50009-2001). Beijing, China: China Architecture & Building Press; 2002.

[54] Moghaddam H, Mohammadi RK. Ductility reduction factor of MDOF shear-building structures. J Earthq Eng. 2001;5:425每40.

[55] Lu XZ, Ye LP, Ma YH, Tang DY. Lessons from the collapse of typical RC frames in Xuankou school during the Great Wenchuan Earthquake. Adv Struct Eng. 2012;15:139每54.

[56] Lu XZ, Lu X, Guan H, Zhang WK, Ye LP. Earthquake-induced collapse simulation of a super-tall mega-braced frame-core tube building, J Constr Steel Res. 2013;82:59每71.

 [57] Miao ZW, Ye LP, Guan H, Lu XZ. Evaluation of modal and traditional pushover analyses in frame-shear-wall structures. Adv Struct Eng. 2011;14:815每36.


Figure Captions

Fig. 1.         Flow chart of the program.

Fig. 2.         Flow chart of the Seismic Analysis Module.

Fig. 3.         Multi-story concentrated-mass shear model for a building.

Fig. 4.         Multi-story concentrated-mass shear model for a group of buildings.

Fig. 5.         Relationship between the number of stories and the average computational time for one building.

Fig. 6.         Benchmark results for the block size of the GPU/CPU cooperative computing program with 1,024 buildings.

Fig 7.          Weak-scaling benchmark for the CPU and GPU/CPU cooperative program.

Fig. 8.         Ratio between the CPU computational time and GPU/CPU cooperative computational time.

Fig. 9.         3D building models of the urban area.

Fig. 10.       Maximum story damage states of the buildings (average among the 5 records in each group).

Fig. 11.       Partial view of the damage states (record: IMPVALL/H-E06_233, PGA: 200 cm/s2).

Fig. 12.       Partial view of the peak acceleration (record: IMPVALL/H-E06_233, PGA: 200 cm/s2).

Fig. A.1.      Backbone curve.

Fig. A.2.      Diagram of the hysteretic models.

Fig. A.3.      Diagram of the pinching envelope of the pinching model.

Fig. B.1.      Process to obtain the parameters of inter-story backbone curve and hysteretic model for a specific special building.


Table Captions

Table 1.       Distribution of buildings for the benchmark.

Table 2.       Results of the GPU/CPU cooperative computation

Table 3.       Results of the CPU computation

Table 4.       Seismic design code used in the urban area under study.

Table 5.       Characteristics of the buildings in the urban area under study.

Table 6.       Selected ground motion records from the PEER-NGA Database.

Table A.1.   Structural types included in this research [7] .

Table A.2.   Parameters for Rayleigh damping [7, 53] .


(a) Entire program

(b) Pre-analysis Module

(c) Post-analysis Module

Fig. 1. Flow chart of the program.


Fig. 2. Flow chart of the Seismic Analysis Module.


Fig. 3. Multi-story concentrated-mass shear model for a building.


Fig. 4. Multi-story concentrated-mass shear model for a group of buildings.


(a) Single precision

(b) Double precision

Fig. 5. Relationship between the number of stories and the average computational time for one building.


Fig. 6. Benchmark results for the block size of the GPU/CPU cooperative computing program with 1,024 buildings.


(a) CPU and GPU/CPU cooperative computing

(b) GPU/CPU cooperative computing only.

Fig 7. Weak-scaling benchmark for the CPU and GPU/CPU cooperative programs.


Fig. 8. Ratio between the CPU computational time and GPU/CPU cooperative computational time.


(a) Top view

(b) Oblique view.

Fig. 9. 3D building models of the urban area.


(a) Proposed MCS model

(b) SDOF model

Fig. 10. Maximum story damage states of the buildings (average among the 5 records in each group).


(a) Damage states of each story of the buildings with the proposed MCS model

(b) Maximum damage states of the buidings with the SDOF model

Fig. 11. Partial view of the damage states (record: IMPVALL/H-E06_233, PGA: 200 cm/s2).


(a) Peak acceleration of each story of the buildings with the proposed MCS model

(b) Top-story peak acceleration of the buildings with the SDOF model

Fig. 12. Partial view of the peak acceleration (record: IMPVALL/H-E06_233, PGA: 200 cm/s2).


Fig. A.1. Backbone curve.


(a) Modified-Clough model

(b) Bilinear elasto-plastic model

(c) Pinching model

Fig. A.2. Diagram of the hysteretic models


Fig. A.3. Diagram of the pinching envelope of the pinching model.


Fig. B.1. Process to obtain the parameters of inter-story backbone curve and hysteretic model for a specific special building.


Table 1. Distribution of buildings for the benchmark.

Structural Type

Description

Range of Stories

Number of Buildings

W1

Wood Light Frame

1每2

51

S1L

Low-rise Steel Moment Frame

1每3

43

S1M

Mid-rise Steel Moment Frame

4每7

55

S1H

High-rise Steel Moment Frame

8每10

83

S3

Steel Light Frame

All

54

C1L

Low-rise Concrete Moment Frame

1每3

55

C1M

Mid-rise Concrete Moment Frame

4每7

58

C1H

High-rise Concrete Moment Frame

8每10

52

C2L

Low-rise Concrete Shear Walls

1每3

68

C2M

Mid-rise Concrete Shear Walls

4每7

52

C2H

High-rise Concrete Shear Walls

8每10

69

C3L

Low-rise Concrete Frame with Unreinforced

Masonry Infill Walls

1每3

51

C3M

Mid-rise Concrete Frame with Unreinforced

Masonry Infill Walls

4每7

34

C3H

High-rise Concrete Frame with Unreinforced

Masonry Infill Walls

8每10

49

RM2L

Low-rise Reinforced Masonry Bearing Walls

1每3

51

RM2M

Mid-rise Reinforced Masonry Bearing Walls

4每7

57

RM2H

High-rise Reinforced Masonry Bearing Walls

8每10

47

URML

Low-rise Unreinforced Masonry Bearing Walls

1每2

50

URMM

Mid-rise Unreinforced Masonry Bearing Walls

3每7

45

Total


1024


Table 2. Results of the GPU/CPU cooperative computation

Maximum inter-story drift ratio

1F

2F

3F

4F

5F

Single precision

0.006203

0.007796

0.006722

0.005461

0.002684

Double precision

0.006204

0.007799

0.006722

0.005466

0.002683

Difference

0.01%

0.03%

0.00%

0.08%

0.05%


Table 3. Results of the CPU computation

Maximum inter-story drift ratio

1F

2F

3F

4F

5F

Single precision

0.006204

0.007798

0.006723

0.005465

0.002684

Double precision

0.006204

0.007799

0.006722

0.005466

0.002683

Difference

0.00%

0.01%

0.01%

0.01%

0.01%


Table 4. Seismic design code used in the urban area under study.


Construction Period

Pre-1978

1979-1989

Post-1989

Seismic Design Code

Pre-Code

Low-Code

Moderate-Code


Table 5. Characteristics of the buildings in the urban area under study.

Structural Type

Description

Range of Stories

Moderate-Code

Low- Code

Overall

C1L

Low-rise Concrete Moment Frame

13

6

0

6

C1M

Mid-rise Concrete Moment Frame

47

2421

428

2849

C2H

High-rise Concrete Moment Frame

8+

14

2

16

RM2H

High-rise Reinforced Masonry Bearing Walls

8+

5

1

6

S1H

High-rise Steel Moment Frame

13

4

0

4

S1M

Mid-rise Steel Moment Frame

47

6

21

27

URML

Low-rise Unreinforced Masonry Bearing Walls

12

0

1

1

URMM

Mid-rise Unreinforced Masonry Bearing Walls

3+

0

1308

1308

W1

Wood Light Frame

12

34

4

38

Total


2490

1765

4255


Table 6. Selected ground motion records from the PEER-NGA Database.

No.

Far-Field

Near-Field with Pulses

Near-Field without Pulses

1

NORTHR/MUL009

IMPVALL/H-E06_233

GAZLI/GAZ_177

2

DUZCE/BOL000

ITALY/A-STU_223

IMPVALL/H-BCR_233

3

HECTOR/HEC000

SUPERST/B-PTS_037

NAHANNI/S1_070

4

IMPVALL/H-DLT262

LOMAP/STG_038

LOMAP/BRN_038

5

KOBE/NIS000

ERZIKAN/ERZ_032

CAPEMEND/CPM_260


Table A.1. Structural types included in this research [7] .

Label

Description

Height

Range

Typical Buildings in HAZUS

Name

Stories

Stories (N0)

Height (ft.)

W1

Wood, Light Frame


12

1

14

S1L

Steel Moment Frame

Low-Rise

13

2

24

S1M

Mid-Rise

47

5

60

S1H

High-Rise

8+

13

156

S3

Steel Light Frame


All

1

15

C1L

Concrete Moment Frame

Low-Rise

13

2

20

C1M

Mid-Rise

47

5

50

C1H

High-Rise

8+

12

120

C2L

Concrete Shear Walls

Low-Rise

13

2

20

C2M

Mid-Rise

47

5

50

C2H

High-Rise

8+

12

120

C3L

Concrete Frame with Unreinforced Masonry Infill Walls

Low-Rise

13

2

20

C3M

Mid-Rise

47

5

50

C3H

High-Rise

8+

12

120

RM2L

Reinforced Masonry Bearing Walls with Precast Concrete Diaphragms

Low-Rise

13

2

20

RM2M

Mid-Rise

47

5

50

RM2H

High-Rise

8+

12

120

URML

Unreinforced Masonry Bearing Walls

Low-Rise

12

1

15

URMM

Mid-Rise

3+

3

35


Table A.2. Parameters for Rayleigh damping [7, 53] .

Structural Type

= 1 = 2

Steel structure (i.e., S1, S3)

0.05

Concrete structure (i.e., C1, C2, C3)

0.07

Masonry structure (i.e., RM2, URM)

0.10

Wood structure (i.e., W1)

0.10


[*] Corresponding author. Tel.: 86-10-62795364; E-mail address: luxz@tsinghua.edu.cn.

Introduction
Research
Application
Teaching
Publications
Download
Issues
Others


Our Lab

Collapse Prevention Committee