4 Impact between different models and a containment building
4.1 Modeling of the containment building
As mentioned above, the fidelity of aircraft models will affect the impact
force. Note that the time histories of the impact forces differ when the target
shape is changed [7]. Note also that, unlike the rigid wall, the material
models used in the FE model of the containment building are more complicated.
Therefore, the impacts between different aircraft models and a containment
building must be studied.
The nuclear power plant containment building selected
in this study is a typical containment building that will be widely adopted
in China. It is a double-skin steel-plates concrete containment building.
The body of the containment building is a cylinder, and the dome is a hemispherical
shell structure. The geometry of the containment building is shown in Figure
8. The radius of the cylinder and the hemispherical shell is 22 m. The height
of the cylinder is 44 m. The wall of the containment building is 1 m thick
concrete covered by two 13-mm-thick steel plates. The total height of the
structure is 66 m. Shell elements are used to model the steel plates, and
solid elements are used to model the concrete in the FE model. The global
mesh size is 500 mm for the steel plates. For the inter concrete, the mesh
size is 500 mm ˇÁ 500 mm ˇÁ 250 mm by subdividing its thickness into four layers.
Similar mesh strategy is also adopted by Siefert & Henkel [11] and Jeon
et al. [8]. Approximately 310,000 shell elements and 620,000 solid elements
are formed after meshing. The shell elements share nodes with the adjacent
solid elements in the FE model of the containment building [7-8, 11-12]. In
the FE model, the Johnson-Cook model (i.e., Mat15 in LS-DYNA) is used to simulate
the steel, and the Concrete_Damage_Rel3 model (i.e., Mat72 in LS-DYNA) is
used to simulate the concrete with a compressive strength of fc
equals 48 MPa.
Figure 8 The FE model of the nuclear power plant containment
building
4.2 Validation for the material model of the containment
building
The material models used in the impact simulation can be divided into
two groups: (1) the metal materials and (2) the concrete material. The models
for the metal materials, such as the John-Cook model and the Plastic Kinematic
model, have already been widely used and validated in previous studies [4,
7, 17, 27, 29-30].
By contrast, the constitutive models of the concrete
used in related studies differed from each other. For example, among the impact
simulations using LS-DYNA in previous studies, different material models,
such as Mat16, Mat72, Mat84 and Mat159, were used by different researchers
to model the concrete [3, 29-30, 32]. In this study, the concrete of the containment
building is modeled by the Concrete_Damage_Rel3 material (i.e., Mat72 in LS-DYNA).
To validate the rationality of the concrete material model
and the corresponding material parameters, the impact tests on a GE J79
engine conducted by Muto et al. [33] are simulated in this work. Although
Muto et al. conducted the impact tests of different scales [33-34], only their
scaled model tests considered different impact velocities (100 m/s, 150 m/s
and 215 m/s), which are similar to the impact velocities of the aircraft in
the subsequent simulations of this work. Furthermore, three different failure
modes of the concrete panels were observed in the scaled tests. Therefore,
the scaled model tests are used for the validation of the concrete material
model.
A 1/7.5 ratio engine model was constructed by Muto et
al. [33]. The three tests using deformable engine models are simulated herein.
The test device and the FE model are shown in Figure 9. The mass of the engine
model is 3.6 kg. Eight-node solid elements and truss elements (i.e. LINK
160) are used to model the concrete and the rebars, respectively. The nodes
are shared between the truss elements and the solid elements to ensure the compatibility of displacement.
The material model of the rebar adopts the Plastic Kinematic model. The Belytschko-Lin-Tsay
thin shell elements are used to model the engines. The material model of the
engines is the Johnson-Cook model. The typical parameters of these materials
are given in Table 5, and 286,000 elements are used for the entire model.
|
|
|
|
(a)
Impact test device
|
(b)
Finite element model
|
Figure 9 The test device and the FE model used in the
engine impact tests
Table 5 Typical material parameters of the
engine impact tests
| |
E
(MPa)
|
fc (MPa)
|
fy (MPa)
|
fu (MPa)
|
|
Concrete
|
/
|
25.5
|
/
|
/
|
|
Rebar
|
2.05ˇÁ105
|
/
|
447.2
|
585.1
|
|
Steel (Engine)
|
2.14´105
|
/
|
411.9
|
705.1
|
E
is the elastic modulus of the material; fc is compressive
strength of the concrete; fy and fu are
the yield and ultimate strength of the rebar and the steel, respectively.
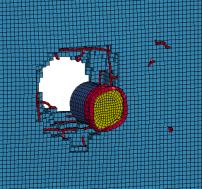
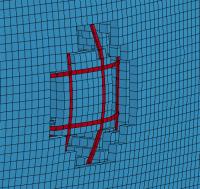
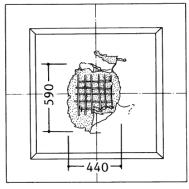
The damage of the concrete panels is simulated under
the impact velocities of 100 m/s, 150 m/s and 215 m/s, respectively. The comparison
between the numerical simulations and the tests is shown in Table 6. The simulation
shows that when the impact velocity equals 215 m/s, the engine model perforates
the target, and a 190-cm-diameter hole is left on the concrete panel (Figure
10), which is very close to the test observation. The curve of the residual velocity
shown in Figure 11 is also very close to the one measured in the test (i.e.,
54 m/s). When the impact velocities equal 100 and 150 m/s, no perforation
occurs both in the test and the simulation. And the damage of the concrete
panel from the numerical simulation is very close to the test observation
(Figure 12), which further validates the concrete model of the simulation.
|
|
|
|
Figure 10 Comparison between the simulation and the
experimental result of the engine impact (v = 215 m/s)
|
Figure 11 Residual velocity of the engine after the perforation
|
|
|
|
Figure 12 Comparison between the simulation and the
experimental result for the engine impact (v = 150
m/s)
|
Table 6 Results of tests and simulations of
the engine impact tests
|
Engine velocity
|
Experimental result
|
Simulation result
|
Remark
|
|
100 m/s
|
Penetration
|
Penetration
|
/
|
|
150 m/s
|
Scabbing
|
Scabbing
|
Figure 10
|
|
215 m/s
|
Perforation
|
Perforation
|
Figure 8
|
4.3 The aircraft impact simulation
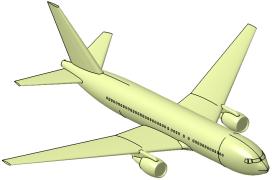
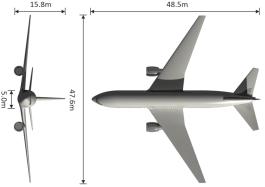
In the ˇ°September 11ˇ± terrorist attack, the speed of the Boeing 767 reached
235 m/s. Among the related studies, the impact velocities are between 100
m/s and 300 m/s [7]. Because the height of the containment
buildings is much lower than the normal flight altitude, the impact velocity
of the aircraft is likely to be lower as well. Therefore, impact velocities
of 100 m/s, 150 m/s, 200 m/s and 250 m/s are simulated in this study corresponding
to low-speed (i.e., v = 100 m/s), mid-speed (i.e., v = 150 m/s
and 200 m/s) and high-speed (i.e., v = 250 m/s) situations.
4.3.1 Aircraft impact process
The entire impact process is very complicated. The impact can be roughly
divided into the following four phases: (1) the fuselage impact, (2) the engines
impact, (3) the wings impact and (4) the tail impact. The impact of Model
1 on the containment building with an impact velocity of 150 m/s is selected
as a typical example to illustrate the process (Figures 13 and 14). First,
the fuselage of the Boeing 767 impacts the containment building. The engines
then impact the containment building at t = 0.15 s and cause the peak
impact force. From t = 0.15 s to 0.25 s, the impact force decreases
slightly because of the end of the impact from the engines. The impact force
then increases again at t = 0.25 s because the wings impact the containment
building. Finally, the impact force decreases from t = 0.3 s to 0.5
s and the entire process ends.
|
(a)
t = 0.1 s
|
(b)
t = 0.15 s
|
(c)
t = 0.25 s
|
(d)
t = 0.3 s
|
(e)
t = 0.5 s
|
Figure 13 The simulated aircraft impact process on the
containment building
(Model 1; v = 150 m/s)
Figure 14 The time history of the impact force of Model
1 on the containment building (v = 150 m/s)
When the impact velocity equals 100 m/s, the plastic strain of concrete
is shown in Figure 15 at t = 0.45 s. It is obvious that Model 1 with
the highest fidelity and internal structures causes the most severe damage
to the containment building.
Figure 15 Concrete plastic strain at t = 0.45
s (v = 100 m/s)
In Figure 15, there are two zones showing high plastic strain
values. The high plastic strain values in Zone 1 are caused by the bending
moment at the bottom of the containment building induced by the aircraft impact.
Because Model 1 has the largest impact force, the bending moment at the bottom
of the containment building induced by Model 1 is the largest among these
models. The plastic strain values at the outer sides of the containment building
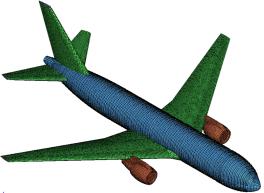
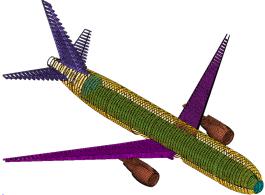
in Zone 2 are caused by the impact of aircraft wings (Figure 16). Specifically,
because the internal structures of Model 3 are not considered, the fuselage
of Model 3 exhibits a significantly smaller stiffness compared to those of
Model 1 and Model 2. Hence, when the aircraft impacts the containment building,
the wings of Model 3 experience the largest displacements, leading to the
highest plastic strain values at the outer sides for Model 3. Similarly, the
beam elements of the internal structures are not modeled in Model 2 and only
the shell elements are considered. The stiffness of the aircraft fuselage
in Model 2 is between those of Model 1 and Model 3. As a result, the area
with high plastic strain values at the outer sides of the containment building
is smaller than that of Model 3 but larger than Model 1.
Figure 16 Deformations of the FE models at t
= 0.45 s (v = 100 m/s)
The impact force and impulse curves are compared among
different models in Figure 17. The peak impact forces of Model 1 and Model
2 are much larger than that of Model 3, which does not consider the internal
structures. Additionally, it can be found that the impulse decreases from
Model 1 to Model 3. There are two main reasons for this phenomenon: (1) the
scattering of the aircraft debris and (2) the erosion of the elements. Because
the width of the aircraft is greater than the containment building, in the
aircraft impact simulations, the debris of the aircraft will scatter during
the impact process (Figure 18). Because the internal structures of Model 3
are not considered, the fuselage of Model 3 exhibits a significantly smaller
stiffness compared to those of Model 1 and Model 2. Hence, when the aircraft
impacts the containment building, more debris of Model 3, which will not contribute
to the total impulse, will scatter, followed by Model 2 and Model 1.
Figure 17 The time histories of the impact forces and
impulses on the containment building (v = 100 m/s)
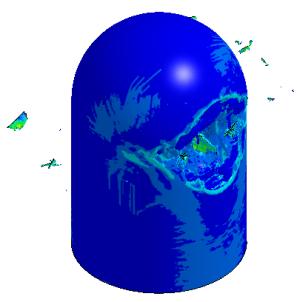
Figure 18 Scattering of the aircraft debris during the
impact process
In addition, the erosion of elements is considered in
simulating the failure of the elements. Therefore, once the deformation of
an element exceeds the corresponding threshold, it will be deleted from the
FE model, which results in a continuous change of mass of the aircraft. As
Model 1 has the largest stiffness, the erosion of the elements is smaller
than those of the other two models. As a result, the mass participation in
the impact are not identical for the models, making the impulse different
for all three models.
Elements failure and scattering of the aircraft debris
are also commonly found in the real aircraft impact situation [2] and numerical
simulations, as reported in many existing literatures [7-8, 10-11]. Model
1, which considers all of the internal structures, has the largest impulse,
and the impulse is almost 30% larger than that of Model 3.
4.3.3 Mid-speed impact
When the impact velocities equal 150 m/s and 200
m/s, the plastic strain distribution of the concrete is shown in Figures 19
and 20. With the increase in the impact velocity, the damage of the containment
building is increasingly severe, which is consistent with the result of Lee
et al. [7]. As the impact
velocity increases, the damage caused by the different models converges.
The range and degree of the damage are basically identical when the velocity
equals 200 m/s.
Figure 19 Concrete plastic strain at t = 0.4 s
(v = 150 m/s)
Figure 20 Concrete plastic strain at t = 0.3 s
(v = 200 m/s)
The time histories of the impact forces and impulses
for different impact velocities are shown in Figures 21 and 22. According
to the curves, the impact forces and impulses of these models increase with
increasing velocities. In the mid-speed impact cases, the peak impact force
of Model 1 and Model 2 are similar, whereas the peak impact force of Model
3 remains lower than that of Model 1. However, the impulse curves of these
models remain different from each other. The final impulse of Model 3 is still
approximately 30% lower than that of Model 1 when the impact velocity is 200
m/s.
Figure 21 The time histories of the impact forces and
impulses on the containment building (v = 150 m/s)
Figure 22 The time histories of the impact forces and
impulses on the containment building (v = 200 m/s)
4.3.4 High-speed impact
When the impact velocity of the aircraft continues to increase, unlike
the mid-speed impact cases, the damage of the containment building caused
by different models differs from each other again. When the impact velocity
equals 250 m/s, the distribution of the plastic strain of concrete at the
front side of the containment building at t = 0.25 s is shown in Figure
23. The distribution of the von Mises stress of the external steel plate at
the back side of the containment building at t = 0.45 s is shown in
Figure 24. Although the plastic strain distribution caused by these models
(Figure 23) is similar, the damage at the back side of the containment building
is different among the three models. Only the fuselage of Model 1 impacts
the back side, causing severe damage to the back side of the containment building.
Because of the simplification of the internal structures in Model 2 and Model
3, the impact forces of the two models are smaller than that of Model 1. As
a result, the critical velocities of Model 2 and Model 3 to penetrate the
containment building will be larger than Model 1. Additional case studies
show that the containment building will be penetrated by Model 2 and Model
3 when the initial velocities equal 300 m/s. Note that the impact force (i.e.
F(t) in Equation 1) relates positively to the square of the velocity.
Therefore, the impact forces at the velocity of 300 m/s are much larger than
that of 250 m/s. However, due to the excessive computational cost (e.g., more
than 100 gigabyte storage and 4 days for just one of the case studies), it
is rather challenge to derive a critical velocity. Further studies are therefore
needed to investigate the critical initial velocities of penetration for FE
models with different fidelities.
Figure 23 Concrete plastic strain at the front side of
the containment building
at t = 0.25 s (v = 250 m/s)
Figure 24 von Mises stress of the external steel plate
at the back side of the containment building at t = 0.45 s (v =
250 m/s)
When the impact velocity equals 250 m/s, the time histories
of the impact forces and impulses are shown in Figure 25. The impact time
of the high-speed impact cases is shorter because of the greater velocity
of the aircraft. Because Model 1 entirely perforates the front side of the
containment building, the impact force of Model 1 is lower than that of Model
2 and Model 3 at t = 0.2 s. However, when the fuselage of Model 1 impacts
the back side of the containment building, the impact force and the impulse
increase and the total impulse of Model 1 becomes larger than that of Model
2 and Model 3 again. Different failure modes of the containment building are
caused by these aircraft models with different fidelities.
Figure 25 The time histories of the impact forces and
impulses on the containment building (v = 250 m/s)
4.3.5 Discussion on the simulation results
According to the simulations above, the time histories
of the impact forces and impulses are closely related to the stiffness and
strength of the aircraft structure. The comparison of the impact forces and
impulses indicates that the impact force of Model 1 is slightly larger than
that of Model 2, and both models are much larger than the most simplified
Model 3. Similarly, the impulse of Model 1 is also the largest among these
models during the entire impact process. The differences in the impact forces
of various models generally decrease with increasing impact velocities. However,
in the high-speed case, the back side of the containment building will only
be impacted by Model 1 because of the perforation of the aircraft, which will
induce a significantly different
damage mode. The over-simplified aircraft model (similar to Model 3) used
in existing studies will underestimate the impact force. Therefore for security
considerations, a detailed model considering the internal structures such
as Model 1 is recommended in the coupling simulation of aircraft impacts.
|