Fast prediction of typhoon tracks based on a similarity method and GIS

Xu Zhen1, , Zou Liang2, Lu Xinzheng1* and Ren Aizhu1

1. Department of Civil engineering, Tsinghua University, Beijing 100084, P. R. China

2. China Academy of Urban Planning & Design, Beijing 100044, P. R. China

*luxz@tsinghua.edu.cn

Disaster Advances, 2013, 6(6): 45-51

Download Full Text

Abstract: A fast method for predicting typhoon tracks based on historical data is proposed in this study. A typhoon track database is built containing 44-year typhoon data for China. Based on this database, typhoon tracks similar to the current typhoon are identified via the similarities of the key typhoon track points and geographic information system (GIS) spatial analysis. The central positions of typhoons after 24 and 48 h are quickly forecasted according to these similar tracks. The prediction results can be continuously corrected by the latest position of a typhoon every 6 h. Three typhoons are chosen to demonstrate the predicted typhoon track, and 103 typhoons in 10 years are used to validate the accuracy of the prediction. The results indicate that the computing time of the prediction is less than 1 min and the accuracy of the prediction is very close to the official prediction of the China Meteorological Administration (CMA). This method provides a quick and accurate reference for predicting typhoons.

Key words: typhoon track; fast prediction; similarity method; GIS; historical data

Download PDF version

1. Introduction

Typhoons often cause serious disasters. For example, hurricane Katrina, which made first landfall in Florida, U.S., in Aug. 2005, resulted in more than 1800 casualties and property damages of 108 billion dollars9. Therefore, precisely forecasting typhoon tracks as soon as possible before they land is important for disaster prevention in typhoon-influenced areas.

Since the 1990s, several well-known numerical models have been widely used in typhoon forecasting, such as the regional model of the Geophysical Fluid Dynamics Laboratory2, 12-14 (GFDL) and the global model of the U.K. Met Office7 (UKMO). With the development of high-performance computing, very fine numerical models can be used, and the accuracy of typhoon track prediction based on numerical analysis has greatly improved5, 10, 11, 21. To date, numerical analysis has become the main method for operational typhoon track prediction18, 22.

However, the accuracy of typhoon track prediction based on numerical analysis relies on the theoretical model of the typhoon. The tracks of typhoons are determined by a number of factors, and a common numerical model for all typhoons still requires further study19,25. Therefore, suitable track prediction models for different typhoons need to be developed according to typhoon characteristics and professional experience22, leading to a complex process of modelling in the numerical analysis of typhoon track prediction. In addition, the numerical analysis of typhoon track prediction requires the support of high-performance computers. Many countries use high-performance computers for official typhoon predictions23, e.g., the European Centre for Medium-range Weather Forecasts (ECMWF) uses a supercomputer with 544 computational nodes (32 4.7 GHz CPUs in each node). For accurate results, ultra-high-resolution analyses are often applied in the prediction of typhoon tracks. These numerical analyses are very time-consuming24, 29. For example, a 5-day typhoon track prediction will cost more than 3700 sec using NASA’s Columbia supercomputer1. Massive-scale and high-resolution numerical analysis is one of the reasons a 6-h time interval is often adopted to release the official typhoon prediction25, 17.

In contrast to the numerical prediction method, typhoon track prediction based on the similarity methods is a simple and fast solution. On one hand, similarity methods solve current problems by selecting suitable cases from the existing data and do not focus on the reasons for the current problems8. Therefore, typhoon track prediction using the similarity method3 only requires the historical data of typhoon tracks and does not rely on the complicated prediction model. On the other hand, typhoon track prediction based on the similarity method can obtain the results in several minutes, or even a few dozen seconds, with a desktop computer, which is far less expensive than supercomputers. Additionally, the prediction results based on the similarity method can satisfy the accuracy demanded for practical applications16, 30.

Therefore, typhoon track prediction based on the similarity method can provide earlier prediction results to supplement the official typhoon prediction based on numerical analysis and can provide an earlier warning time for disaster prevention and mitigation. Moreover, prediction based on the similarity method is a necessary backup solution when numerical analysis is not satisfied, e.g., at local weather stations that have no supercomputers or when supercomputers break down. Due to the complexity of typhoon tracks, prediction based on the similarity method can also be used for comparison with numerical prediction for a more reliable prediction.

Recently, the typhoon studies based on the geographic information system (GIS) have developed rapidly6, 27, 20. Although the powerful spatial analysis function in GIS provides efficient technical support for typhoon track prediction based on the similarity method, the track prediction studies based on GIS and similarity method are still limited 20, 28, 30. Moreover, these studies only focus on the similarity in space or in time separately, without the integration of space, time and other properties. Note that typhoon tracks are determined based on the integrated effects of various factors, so predictions involving a single factor are inaccurate.

Therefore, considering the integrated effects of space, time and other factors, this study uses the similarities of key points of typhoon tracks to find typhoons with similar tracks. Based on historical data, a fast prediction method for typhoon tracking and a corresponding correction method are proposed. This study aims to provide an accurate and quick method for typhoon track prediction, to enable disaster prevention and mitigation to be carried out as soon as possible.

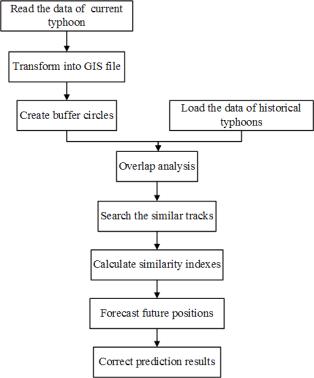
2. Typhoon track prediction based on the similarity method

2.1 Identify similar typhoon tracks

Similar typhoon tracks represent similar reasons for typhoon movement, so similar tracks can be used to forecast the future tracks of current typhoons3. Therefore, identifying similar tracks is the first step in typhoon track prediction based on the similarity method.

The similarity of typhoon tracks can be evaluated by the distance between typhoon tracks15. The shorter the distances between typhoon tracks, the more similar they are. However, evaluating the distance between typhoon tracks is difficult, so a method based on the similarities of key points of typhoon tracks is proposed to find similar tracks, as follows:

1) Searching for similar typhoons

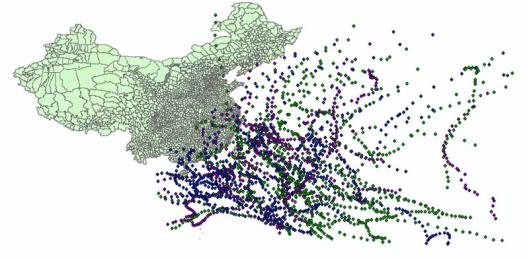
The China Meteorological Administration (CMA) has three criteria for identifying similar typhoons: geographical position similarity, seasonal similarity and moving speed similarity3. This work integrates these three criteria to identify similar typhoons on the GIS platform. First, an overlap analysis of the shapes, direction and spatial relation of the tracks is adopted to search for typhoons that meet the similarity criteria of geographical position and moving speed. Then, the temporal properties of the selected typhoons are searched to find typhoons that meet the similarity criterion of season. That is to say, in the selected typhoons via the overlap analysis, those whose generation time is within one month before or after the current typhoon will be considered as season-similar in this work.

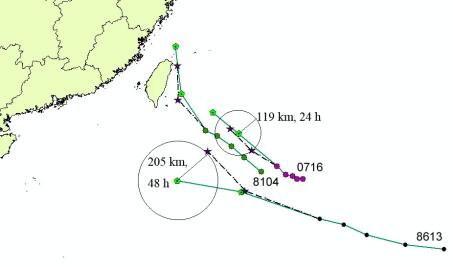
Using the buffer zone in GIS is a good method for searching for similar tracks from a large database of historical typhoons16. In this study, the buffer circles take the recording points of the current typhoon as centers. Only typhoon tracks within the range of buffer circles of the current typhoon will be searched to find a similar typhoon track, which will efficiently reduce the search time, allowing the process of searching for similar typhoons to be completed in several seconds.

2) Calculating the similarity indexes of key points

Because a historical typhoon may have several recording points in the same buffer circle, the recording point of the historical typhoon that is the nearest the centre of the buffer circle is defined as the key point. Define the distance between the key point of the historical typhoon and the recording point of the current typhoon, which is d. The radius of buffer circle is r. Thus, the similarity index of key points in historical typhoon track SIp can be expressed as Eq. (1).


(1)

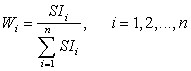
3) Calculating the similarity indexes of historical typhoons

The similarity indexes of historical typhoons are based on the similarity indexes of key points. With the assumption that there are m key points in the historical typhoon track, the similarity index of this historical typhoon track and current typhoon track is calculated as Eq. (2):


(2)

SI is the criterion for identifying similar tracks and ranges from 0 to 1. If SI is close to 0, the track of the historical typhoon is not similar to the current track; if SI is close to 1, the two tracks are very similar.

2.2 Prediction of typhoon tracks

Although similar typhoon tracks are identified by the above method, deciding how to forecast the future track of a current typhoon using these similar tracks is still a question. Lu16 ranked the historical tracks in descending order by similar degrees and then took the following positions of the most similar track as the future positions of the current typhoon. However, this method only takes the most similar track into account and may result in significant errors. For example, some hours later, the most similar track may not be similar to the future track of the current typhoon, while other tracks may become more similar to the future track. Therefore, this study proposes a more accurate prediction method that involves more similar tracks.

1) Selecting the reference points

Forecasting the future positions of a current typhoon requires selecting the suitable recording points of similar tracks as reference points. However, the moving speeds of the similar tracks are not identical to the current typhoon. Because the moving speed of the typhoon will influence the time interval of the key points, this study chooses the recording point at the time shown in Eq. (3) as the reference point.


(3)

where tref is the time corresponding to reference points, and t is the current time. Defining the latest three key points of a similar track as H1, H2 and H3, respectively,  represents the time interval between H1 and H2, while  represents the time interval between H2 and H3.

The time interval between the adjacent recording points is generally fixed to be 6 h. As Figure 1 shows, P1, P2 and P3 are the recording points of 12 h ago, the recording point of 6 h ago and the current recording point, respectively, in the current track. H1, H2 and H3 are the key points in a historical typhoon track, corresponding to P1, P2 and P3 (i.e., the closest points in a historical typhoon track to P1, P2 and P3). By searching the time properties of H1, H2 and H3,  and  are both equal to 12 h. In Figure 1, one more point exists between H1 and H2; this indicates that the time interval between H1 and H2 is 12 h, and the moving speed of this historical typhoon is approximately half the moving speed of the current typhoon. Therefore, according to Eq. (3), the recording point of 12 h later will be selected as the reference point for forecasting the future position of 6 h later.

Recording points of the current typhoon;  Reference point for prediction of 6 h later

Recording points of the historical typhoon; ● Key points of the historical typhoon.

Fig. 1. The method to select the reference points for prediction

2) Forecasting the future position

According to the reference points of similar typhoon tracks, the future position of the current typhoon is calculated by Eq. (4), as follows:


(4)

where T and G represent the longitude and latitude of the future position, respectively. Ti and Gi are the longitude and latitude of the reference point in the i similar track. Wi is the weight of the i similar track in the prediction. Defining the total number of similar tracks as n, Wi can be calculated by using the similarity indexes SIi of the i similar track dividing the sum of all similarity indexes of similar tracks, as shown in Eq. (5):


(5)

3) Correction of the prediction

As the position of the current typhoon is continually updated, the prediction results need to be corrected concurrently. In this study, the new future position is forecasted again according to the latest position of the current typhoon. The average position of the new prediction results and the previous prediction results is calculated using Eq. (6), and this average position will be adopted as the corrected prediction result.

(6)

where t is the current time and  means the fixed time interval of recording points.  is the future position in t + .  represents the future position in t + obtained by the current reference points at t, while  represents the future position in t +  obtained by the previous reference points at t - .

3 Implementation based on GIS

This study collected the textual data of 1,020 typhoon tracks that influenced China within 44 years from 1949 to 2004, and transformed the data into vectorial data (i.e., shapefile data) to build a database of typhoon tracks. This database stores the longitudes and latitudes of recording points every 6 h as well as the recording time, the moving speed, the central air pressures and other properties. The database has a total of 39,606 recording points, as shown in Figure 2.

Fig. 2. All typhoon tracks in the database

According to the above prediction method of typhoon tracking, this study develops a prediction program on the ArcGIS Engine platform. The technical flow of this program is shown in Figure 3. As long as the track data of the current typhoon are available, the program can perform the track prediction automatically.

Fig. 3. Flow chart of the prediction method in this work

4. Validation of the proposed method

From the typhoon database, three typhoons in 1981, 1986 and 2007, which are referred to as 8104, 8613 and 0716, respectively, were randomly selected to validate the proposed track prediction method. Using the proposed method, the positions of these three typhoons after 24 h and 48 h were forecasted as shown in Figure 4.

·           Prediction positions;   Actual positions; 

Recording points of the current typhoon;   Average prediction errors by CMA

Fig. 4. Prediction result of the three typhoons

Figure 4 indicates that the three prediction tracks match the actual tracks. The predicted positions and errors of the three tracks above are shown in Table 1. From Table 1, it can be found that the prediction results at 24 h are very accurate, e.g., the minimum error is 15 km, while the maximum error is merely 131 km. Meanwhile, the errors of the prediction results at 48 h are also less than 207 km. In the official typhoon track prediction of CMA in recent years4, 25, the average prediction error at 24 h is approximately 119 km and the average prediction error at 48 h is 205 km. Therefore, the prediction results of this work are accurate in general.

Table 1 Prediction of the three typhoons

Number of typhoon

Prediction time

/h

Prediction position

Actual

position

Prediction error

/km

Number

of similar

tracks

Ratio of similar tracks in total tracks

/%

8104

24

(N22.4, E122.4)

(N22.9, E122.6)

56

58

4.83

48

(N24.8, E122.3)

(N26.2, E122.2)

151

8613

24

(N15.9, E126.7)

(N16.0, E126.8)

15

55

4.58

48

(N18.4, E123.3)

(N16.8, E122.3)

207

0716

24

(N19.2, E127.4)

(N20.1, E126.6)

131

96

7.99

48

(N20.7, E125.9)

(N21.6, E124.8)

152

The computing time of track prediction is related to the number of similar tracks. The more similar tracks there are, the longer the computing time is. As Table 1 shows, the number of similar tracks is far less than the total number of tracks in the typhoon database. When the maximum number of similar tracks is 96 (Table 1), the total computing time of the prediction is less than 1 min on a desktop computer (CPU: 2.0 GHz; Memory: 1GB). Therefore, this prediction method is low-cost and efficient.

To validate the accuracy of the prediction method, a total of 103 typhoon tracks were selected for the prediction of tracks from 10 years of data, as Table 2 shows. The average error of predictions at 24 h is 132 km, while the average error of predictions at 48 h is 266 km, as shown in Figure 5.

Table 2 The time distribution of the selected typhoons

Year

1981

1985

1986

1987

1989

2001

2003

2004

2005

2007


Sample number

10

10

12

8

10

13

10

12

9

9


Fig. 5. The error distribution of track prediction for 10 years of typhoons

From Figure 5, it can be found that the prediction results by the method in this study are close to the accuracy of the official prediction results of CMA. Note that the prediction method in this work does not rely on a supercomputer and does not take much computing time. Therefore, this method provides an accurate and fast reference for decisions regarding typhoon disaster prevention.

5. Conclusion

Using the similarities of key points proposed in this work and the spatial analysis of GIS, this study proposed a prediction model of typhoon tracks based on historical typhoon data and the corresponding correction method. This study selected typhoon tracks within a period of 10 years to validate the prediction accuracy. The results indicate that the accuracy of this method is close to the official prediction of CMA. Moreover, the study cases prove that this method can obtain the results quickly without relying on supercomputers and is thus a low-cost and efficient prediction method. This study provides an accurate and fast method for typhoon track prediction that can help disaster prevention to be implemented as early as possible.

Acknowledgement

The authors are grateful for the financial support received from the Major S and T Special Project of Ministry of Transport of PR China (No. 2011-318-223-170) and the National Nature Science Foundation of China (No. 51222804).

Reference:

1. Atlas R., Reale O., Shen B.W., Lin S.J., Chern J.D., et al., Hurricane Forecasting with the High-resolution NASA Finite Volume General Circulation Model, Geophy. Res. Lett., 32, L03807 (2005).

2. Bender M.A., Ros R.J., Tuleya R.E. and Kurihara Y.. Improvements in Tropical Cyclone Track and Intensity Forecasts Using the GFDL Initialization Scheme. Mon. Wea. Rev., 121, 2046-2061 (1993).

3. Chen L.S and Ding Y.H., Introduction to the Western Pacific Typhoon, Science Press, China (1979).

4. China Meteorological Administration (CMA), Yearbook of Tropical Cyclone 2011, China Meteorological Press, China (2011).

5. Govett M., Middlecoff J. and Henderson T., Running the NIM Next-Generation Weather Model on GPUs, Proc. 10th IEEE/ACM Int. Conf. Cluster, Cloud and Grid Computing (CCGrid), 792-796 (2010).

6. Guidry V.T. and Margolis L.H., Unequal Respiratory Health Risk: Using GIS to Explore Hurricane-related Flooding of Schools in Eastern North Carolina, Environ. Res., 98(3), 383-389 (2005).

7. Heming J.T., and Radford A.M., The Performance of the United Kingdom Meteorological Office Global Model in Predicting the Tracks of Atlantic Tropical Cyclones in 1995. Mon. Wea. Rev., 126, 1323-1331 (1998).

8. Leake D.B., Kinley A. and Wilson D., Case-based Similarity Assessment: Estimating Adaptability from Experience, Prof. Fourteenth National Conference on Artificial Intelligence, AAAI Press, Menlo Park, CA (1997).

9. Kates R.W., Colten C.E., Laska S. and Leatherman S.P., Reconstruction of New Orleans after Hurricane Katrina: A research perspective, PNAS, 103(40), 14653-14660 (2006).

10. Knutson T.R., et al., Tropical Cyclones and Climate Change, Nat. Geosci., 3, 157-163 (2010).

11. Kumar S.V., An Integrated High-resolution Hydrometeorological Modeling Testbed using LIS and WRF, Environ. Modell. Softw., 23(2), 169-181 (2008).

12. Kurihara Y., Bender M.A. and Ross R.J., An Initialization Scheme for Hurricane Models by Vortex Specification. Mon. Wea. Rev., 121, 2030-2045 (1993).

13. Kurihara Y., Tuleya R.E. and Ross R.J., Improvements in the GFDL Hurricane Prediction System. Mon. Wea. Rev., 123, 2791-2801 (1995).

14. Kurihara Y., Tuleya R.E. and Bender M.A., The GFDL Hurricane Prediction System and Its Performance in the 1995 Hurricane Season. Mon. Wea. Rev., 126, 1306-1322 (1998).

15. Liu Y., Wu B.W. and Wang D.Y. Algorithm Study on Similarity Retrieval of Typhoon Tracks, Meteorological Monthly, 32(7), 18-24 (2006).

16. Lu T., Research on the Northwest Pacific Tropical Cyclone: GIS-based approach, Ph.D. Thesis, East China Normal University (2004).

17. National Hurricane Center (NHC), National Hurricane Center Forecast Process, http://www.hurricanescience.org/science/forecast/forecasting/forecastprocess/. (2012).

18. Rappaport E.N., et al., Advances and Challenges at the National Hurricane Center, Wea. Forecasting, 24, 395-419 (2009).

19. Surgi N., et al., The Hurricane WRF (HWRF): Addressing Our Nation’s Next Generation Hurricane Forecast Problems, Proc., 27th Conf. on Hurricanes and Tropical Meteorology, Monterey, CA, Amer. Meteor. Soc., CD-ROM, (2006).

20. Taramellia A., et al., Modelling Risk Hurricane Rlements in Potentially Affected Areas by a GIS System, Geomatics, Natural Hazards and Risk, 1(4), 349-373 (2010).

21. Torn R.D., Performance of a Mesoscale Ensemble Kalman Filter (EnKF) during the NOAA High-Resolution Hurricane Test, Mon. Wea. Rev., 138, 4375-4392 (2010).

22. Weber H.C., Hurricane Track Prediction Using a Statistical Ensemble of Numerical Models, Mon. Wea. Rev., 131, 749-770 (2003).

23. World Meteorological Organization (WMO), Rep., 27th Session of the CAS/JSC Working Group on Numerical Experimentation, http://www.wmo.int/pages/about/sec/rescrosscut/resdept_wgne.html (2011).

24. Wu X.J., Jin Z.Y., Chen D.H., Song J.Q. and Yang X.D., A Parallel Computing Algorithm and Its Application in New Generation of Numerical Weather Prediction System (GRAPES), Journal of Computer Research and Development, 44(3), 510-515 (2007).

25. Xu Y.L., Zhang L. and Gao S.Z.. The Advances and Discussions on China Operational Typhoon Forecasting, Meteorological Monthly, 36(7), 43-49 (2010).

27. Yi Y., Wang J., Mao Q.W. and Qi Y.Q., Prediction System of Typhoon Wind and Wave in the South China Sea based on GIS, Marine Science Bulletin, 27(6), 76-81 (2008).

28. Zhang Z., Krishnamurti T.N., A Perturbation Method for Hurricane Ensemble Predictions. Mon. Wea. Rev., 127, 447–469 (1999).

29. Zhang Y., Chen D.H., A Brief Overview on the Progresses of Numerical Weather Prediction with Support of High Performance Computer Technology, e-Science Technology & Application, 1(4), 9-19 (2010).

30. Zhu H.Y., Research on the Tropical Cyclone based on Spatial Analysis in GIS, Ph.D. Thesis, East China Normal University (2005).

  *


* Author for Correspondence

Introduction
Research
Application
Teaching
Publications
Download
Issues
Others


Our Lab

Collapse Prevention Committee