Post-earthquake fire simulation considering overall seismic damage of sprinkler systems based on BIM and FEMA P-58

Zhen Xua, Zongcai Zhanga, Xinzheng Lub,*, Xiang Zengb, Hong Guanc

a School of Civil and Resource Engineering, University of Science and Technology Beijing, Beijing 100083, China;

b Key Laboratory of Civil Engineering Safety and Durability of China Education Ministry, Department of Civil Engineering, Tsinghua University, Beijing 100084, China

c Griffith School of Engineering, Griffith University Gold Coast Campus, Queensland 4222, Australia

Automation in Construction, 2018, 90: 9-22.

Download Full PDF Version

Abstract: In this study, a post-earthquake fire simulation method considering the seismic damage of sprinkler systems is proposed to quantitatively assess the impact of the spread of fire owing to such damage. First, a modeling approach is designed to convert a building information model (BIM) to a computational fluid dynamics (CFD) model, thereby creating a high-fidelity model of a building and its sprinkler system in the fire dynamics simulator (FDS) program. Second, a probabilistic method for predicting the seismic damage of sprinkler components (including pipes and drops) is developed according to the next-generation performance-based design method in the Federal Emergency Management Agency (FEMA) P-58 report. Finally, using the seismic damage of the components, a prediction method is proposed to assess the overall seismic damage of the sprinkler system based on a tree data structure. A post-earthquake fire simulation of a six-story dormitory building is performed using the proposed method. The results indicate the level of effect that the seismic damage of the sprinkler system will have on the spreading of a post-earthquake fire. The outcome of this study provides an important practical method for quantitatively assessing the effect of the seismic damage of sprinkler systems on a post-earthquake fire.

Key words: post-earthquake fire; sprinkler system; BIM; FEMA P-58; tree data structure.

1. Introduction

1.1 Research background

Post-earthquake fire is a common secondary hazard induced by earthquakes [1]. Historically, some severe post-earthquake fire events have occurred in major cities worldwide, such as those in San Francisco in 1906 [2], Tokyo in 1923 [3], and Osaka and Kobe in 1995 [4]. Specifically, in case of the Kobe earthquake, the area burnt by the post-earthquake fire was approximately 100 ha, the largest burned area since World War II [4]. The Great East Japan Earthquake in 2011 induced 278 post-earthquake fires, which aggravated deaths and economic losses [5]. Therefore, post-earthquake fire is a significant issue in earthquake disaster mitigation.

Fire sprinkler systems are required to be installed in most modern-day buildings as one of the most important fire-fighting measures. However, sprinkler systems can get damaged during an earthquake, e.g., in the Kobe earthquake, the ratio of damaged sprinkler systems was 40.8% [6]. To date, several studies have been performed to predict the seismic damage of sprinkler components [7每9], but only limited work has been conducted to quantitatively assess the effect of such damage on the post-earthquake fire spreading process. Sekizawa et al. [6] proposed a simplified method to estimate the potential impact caused by damaged sprinkler components on the spreading of a fire. However, because the overall seismic damage of the sprinkler system is not considered in their work, the estimated impact is difficult to be accurately quantified. Consequently, a method considering the overall seismic damage of sprinkler systems is required to quantitatively assess the influences on post-earthquake fires.

1.2 Research challenges

A post-earthquake fire simulation considering the overall seismic damage of sprinkler systems can address the above problem. To implement such a simulation, the following three key challenges need to be addressed: (1) Creation of a high-fidelity numerical model of a sprinkler system using a fire simulation program (e.g., Fire Dynamics Simulator, FDS [10]). Note that a sprinkler system consists of numerous components (e.g., drops and pipes) of different sizes and at various spatial locations, and is therefore quite complex. An efficient model generation method that replicates this complex system is desirable as it will drastically facilitate the fire simulation. (2) Accurate prediction of the seismic damage of the components of a sprinkler system, considering the randomness of such damage. (3) Prediction of the overall seismic damage of a sprinkler system based on damaged sprinkler components.

To deal with Challenge (1), the building information modeling (BIM) technology [11] can be adopted to construct high-fidelity information models of sprinkler systems. Specifically, some existing BIM programs (e.g., Revit and MagiCAD) provide useful libraries with abundant sprinkler components [12每13] with which a refined three-dimensional (3D) sprinkler system can be easily built [14]. In addition, such information models of sprinkler systems can provide detailed attribution data (such as component types and spatial coordinates) required for generating the computational fluid dynamics (CFD) models for fire simulations. Existing software (e.g., PyroSim) can convert a BIM model to a CFD model [15], but such a model conversion is mainly focused on the geometric information, and a large amount of the attributions in the BIM model are lost after the conversion. It is worth noting that some attributions that are essential for fire simulations (e.g., the materials of the building components) must be retained. Therefore, it is important to develop a model conversion method that transfers all the attributions to the fire simulations.

Regarding Challenge (2), various studies have been performed to predict the seismic damage of the components of a sprinkler system [1619]. Among these, the Federal Emergency Management Agency (FEMA) P-58 report [20, 21] published by FEMA, USA can be used as a guideline to predict the seismic damage probabilities of sprinkler components. FEMA P-58 is a methodology for the seismic performance assessment of individual buildings, which includes the implementation methodology and data that are demanded by the methodology. These data have been collected from numerous seismic experiments and simulations over a ten-year work effort [20, 21]. In particular, FEMA P-58 provides various fragility curves for different types of sprinkler components. The randomness of the seismic damage of sprinkler systems is also considered in the fragility curves. In addition, the FEMA P-58 methodology is not region-specific because the proposed seismic performance assessments are dependent on the engineering demand parameters (EDPs), which can be calculated for any earthquake [22].

For Challenge (3), no perfect solution is reported in the literature yet. Till date, the research has primarily focused on the seismic damage prediction for sprinkler components [6每9, 16每21], whereas the seismic damage of the entire sprinkler system has been rarely considered. Owing to the interconnectedness of different sprinkler components, a damaged component will inevitably affect the other connected components. To consider the above effect, it is necessary to calculate the overall seismic damage of a sprinkler system including the damage states and hydraulics losses (e.g., pressure and quantity of flow). In reference to the existing work on water-pipe and traffic networks [23, 24], a sprinkler system can be considered as a typical tree data structure. Accordingly, the overall seismic damage of a sprinkler system can be calculated based on the component damage via the analysis of a tree data structure.

1.3 Overview of this study

In this study, a post-earthquake fire simulation method considering the overall seismic damage of a sprinkler system is proposed in view of the above-mentioned possible solutions for addressing the three challenges. Specifically, a BIM-based modeling approach is designed to build a high-fidelity fire simulation model of a sprinkler system. The FEMA P-58 method is used to predict the seismic damage of the sprinkler components, and based on the component damage, a tree-based method is developed to predict the overall seismic damage of the sprinkler system. A post-earthquake fire simulation of a six-story office building is performed using the proposed simulation method. The results indicate the level of effect that the seismic damage of the sprinkler system will have on the spreading of a post-earthquake fire. The outcome of this study provides an important practical approach for quantitatively assessing the effect of the seismic damage of sprinkler systems on post-earthquake fires.

2. Simulation methods

2.1 Proposed framework

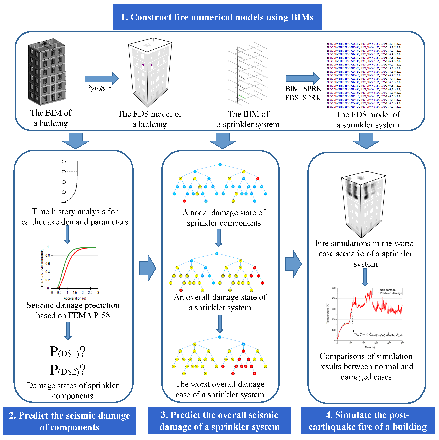
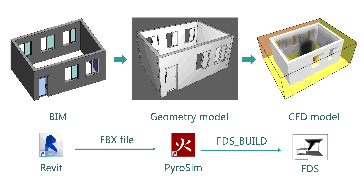
The proposed framework of the post-earthquake fire simulation considering the overall seismic damage of a sprinkler system is illustrated in Figure 1. It includes four steps. In the first step, the fire numerical models of a building and its sprinkler system are constructed based on their information models. These information models are also used to provide necessary data (e.g., the numbers and types of different components) for the seismic damage prediction of a sprinkler system. In the second step, the seismic damage of each sprinkler component is predicted using the fragility curves in FEMA P-58. Next, the overall seismic damage of a sprinkler system is predicted based on a tree data structure. In addition, the worst overall damage state of a sprinkler system is determined by identifying the critical nodes that contain the most child nodes in the tree structure. Last, a post-earthquake fire is simulated in the scenario of the above-mentioned worst damage state to quantitatively assess the effect of the damaged sprinkler system on the spreading of the post-earthquake fire.

Fig. 1. Framework of the proposed simulation method

2.2 High-fidelity modeling based on BIM

As a widely-used BIM program, Revit [12] is adopted in this study to generate detailed 3D information models of the buildings and their sprinkler systems. Subsequently, FDS, an internationally well-accepted fire simulation program developed by the National Institute of Standards and Technology (NIST) of the United States [10], is adopted for performing the fire simulations. A modeling method is proposed to build the FDS model using the information models of the buildings and sprinkler systems.

(1) Constructing the FDS model of a building

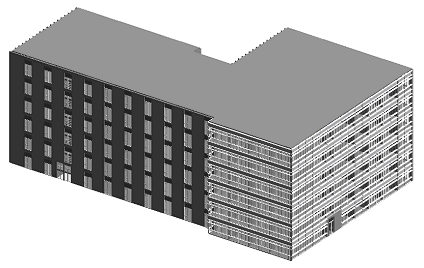
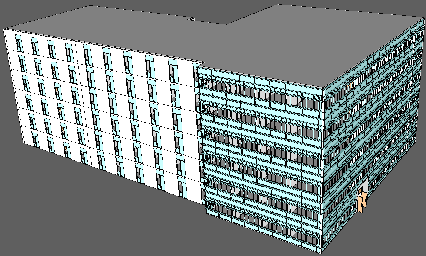
The geometrical and material data of a building are necessary for a fire simulation because they can determine the spatial constraints for the fire spread and burning characteristics of the building components, respectively. PyroSim [15], a pre-processing program for FDS, is used to construct the 3D geometrical model of a building in FDS by using its information model. Specifically, first, the information model in Revit is exported to the Filmbox (FBX) files, which are then imported into PyroSim to generate the FDS model (See Figure 2). Such an FDS model converted by PyroSim retains the geometries and identifications (IDs) of the building components, but their material data are lost in the conversion. Subsequently, in this work, a post-processing program named FDS_BUILD is developed to extract the material data from the information model based on the IDs of the building components and supply the extracted material data to the FDS model (See Figure 2). By employing PyroSim and the developed FDS_BUILD a complete model conversion capable of retaining all the geometrical and material data is achieved to transform the information model to an FDS model.

Fig. 2. Modeling method of a building for FDS based on BIM

(2) Building the FDS model of a sprinkler system

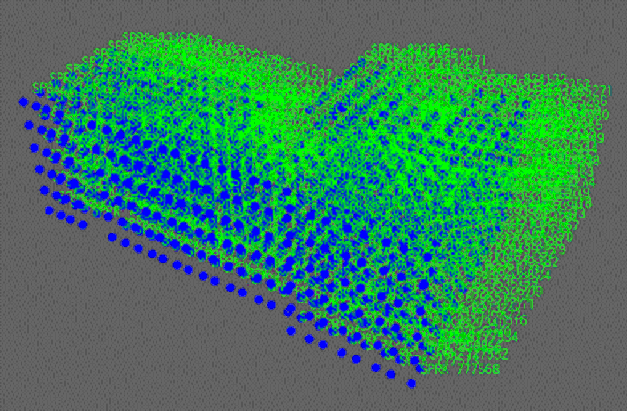
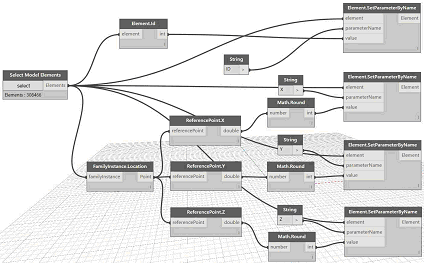
Parameters such as the individual ID, type, and spatial coordinates of each sprinkler component are required to build the FDS model of the associated sprinkler system. These parameters are previously included in the BIM of the sprinkler system. Therefore, in this study, a program named BIM_SPRK is developed based on Dynamo [25] (an open-source graphical programming tool for BIM) to obtain the required parameters from the information model of a sprinkler system. The framework of BIM_SPRK is shown in Figure 3. First, a filter function named ※select model elements§ is defined to filter the different types of sprinkler components; then, two functions, namely, ※Element.ID§ and ※FamilyInstance.Location§ are adopted to obtain the IDs and locations of all the sprinkler components. The location values can be decomposed into spatial coordinates (i.e., x, y, and z) by using the classes ※ReferencePoint§ and ※Math§. Finally, the IDs and spatial coordinates of a specific type of component are generated by using the function ※Element.SetParameterByName§. Thus, by using BIM_SPRK, the IDs, types, and spatial coordinates of all the sprinkler components can be extracted.

Fig. 3. Framework of BIM_SPRK

A program named FDS_SPRK is also developed to generate the FDS model of a sprinkler system based on the data extracted by BIM_SPRK. In addition, FDS_SPRK subsequently stores the data of the sprinkler system in an SQL server database [26] because these data will be used to calculate the overall seismic damage of the sprinkler system.

(3) Validation of the proposed modeling method

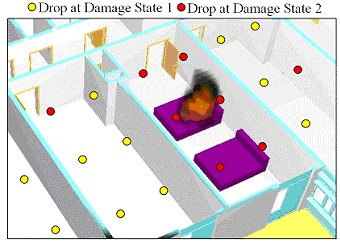
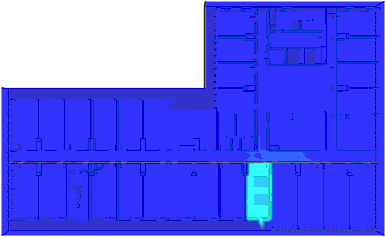
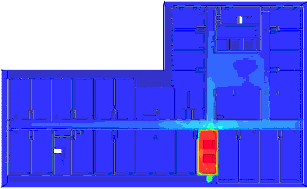
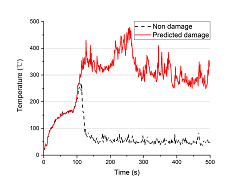
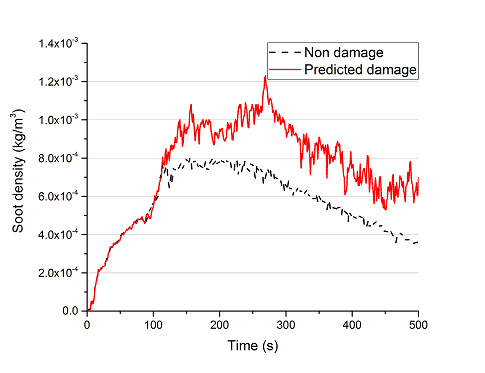
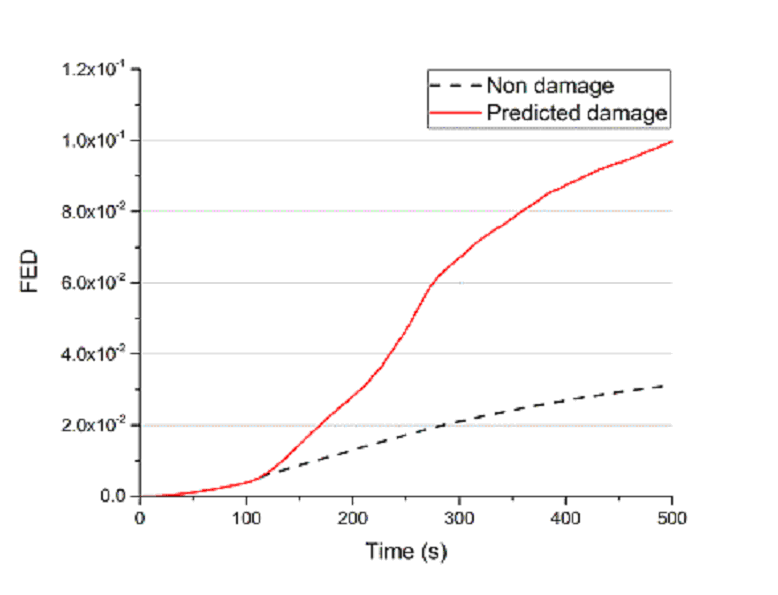
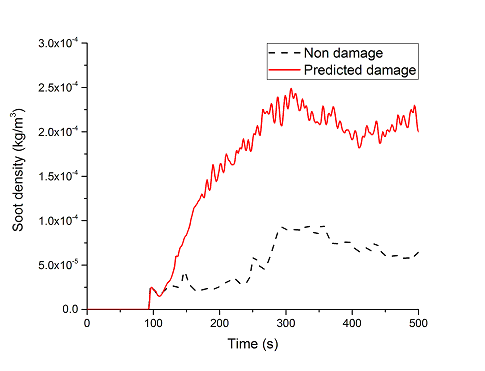
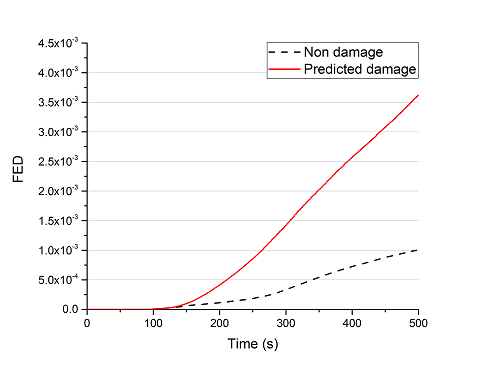
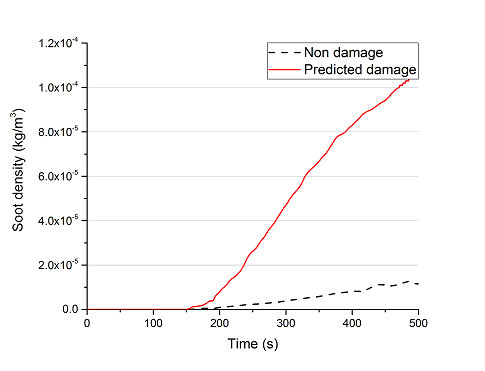
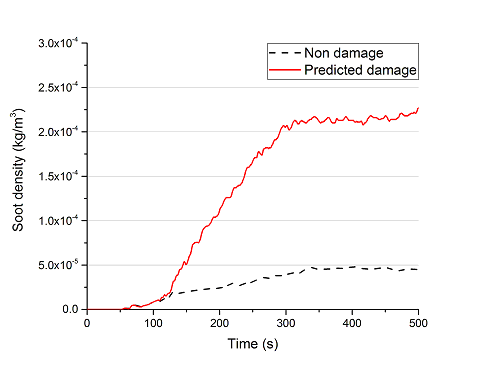
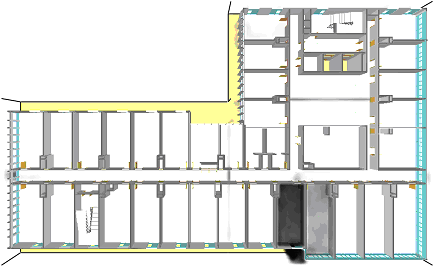
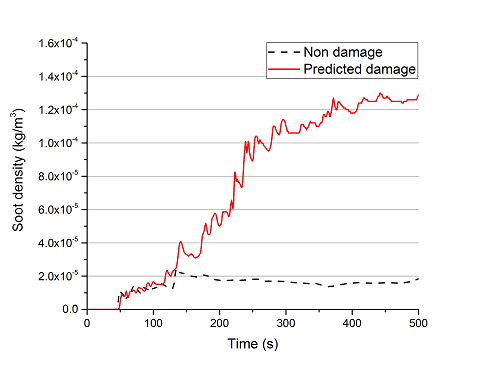
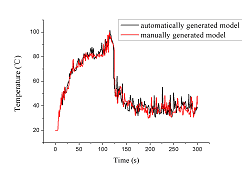
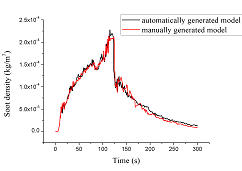
To validate the proposed modeling method, a typical single room with four sprinkler drops, as shown in Figure 4, is used as a benchmark case. Two FDS models are constructed for the fire simulations: one is built using the proposed modeling method (referred as the ※automatically generated model§), whereas the other (referred as the ※manually generated model§) is constructed manually to ensure it includes the accurate and complete data for a fire simulation. The spreading process of a fire is simulated in FDS using the two models under the same conditions, and two important results (i.e., soot density and temperature) are compared in Figure 5. The results of the two models are found to be almost identical. The minor differences between the results are mainly attributed to the random nature of the calculation in FDS [10], which is considered acceptable in a fire simulation. Following this validation, the model generated by the proposed method is used for the fire simulations in FDS.

Fig. 4. Planar layout of a typical single room

(a) Temperature curves

(b) Soot density curves

Fig. 5. Comparisons of simulation results between the automatically generated model and the manually generated model

2.3 Predicting seismic damage of each sprinkler component

According to FEMA P-58, a nonlinear time-history analysis (THA) of a building needs to be performed first to calculate the peak floor accelerations (PFAs). Subsequently, the probabilities of the seismic damage states of the sprinkler components can be determined by using the calculated PFAs and fragility curves in FEMA P-58.

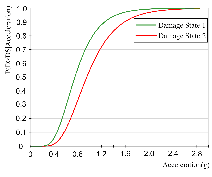
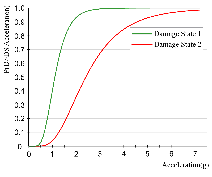
Significant amount of research work has been conducted on the nonlinear THA of a building, using either very detailed structural models [27] or highly efficient computational structural models [28]. In this work, a THA of detailed structural models is performed to provide more accurate PFAs. According to FEMA P-58, the components of a sprinkler system can be classified into two categories: sprinkler drops and water pipes. Various fragility curves of these two types of components are also provided in FEMA P-58, and two typical curves are illustrated in Figure 6. Two damage states (DSs) (referred as DS1 and DS2) are defined in FEMA P-58 for both pipes and drops, as listed in Table 1. It can be inferred that both pipes and drops suffer different losses in the quantity of flow at DS1 and a significant leakage at DS2 that is regarded as complete damage. The probabilities of P(DS1) and P(DS2) of each component on each story of the building are calculated [21] using Eqs. (1) and (2). Here, P(DSDS1) and P(DSDS1) in Eqs (1) and (2) are obtained from the fragility curves in FEMA P-58 based on the PFAs.

(a) Fragility curve of a drop

(b) Fragility curve of a pipe

Fig. 6. Typical fragility curves of sprinkler components

Table 1 Seismic damage states of the sprinkler components

Components

DS1

DS2

Pipe

Quantity of flow: 2%/20 ft

Complete damage

Drop

Quantity of flow: 1%

Complete damage


P(DS2) = P(DSDS2)

(1)


P(DS1) = P(DSDS1) P(DSDS2)

(2)

2.4 Predicting overall seismic damage of a sprinkler system

To predict the overall seismic damage of a sprinkler system, three issues need to be solved: (1) description of the sprinkler system by a highly efficient approach, (2) calculation of the overall damage state of the sprinkler system, and (3) prediction of the worst overall damage state of a sprinkler system. To this end, first, a tree data structure is built to describe the sprinkler system. Subsequently, a method based on the traversal of the child nodes within a tree structure is proposed to predict the overall damage of the sprinkler system. Finally, a method based on the critical nodes (i.e., those with the most child nodes) is proposed to determine the worst overall damage state.

(1) Tree data structure for the sprinkler system

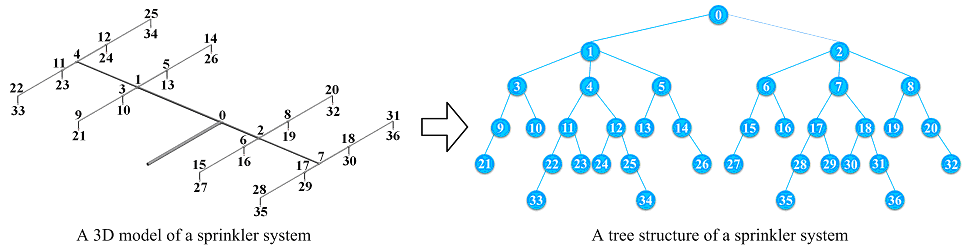
Because a sprinkler system resembles a tree made up of nodes and links, a tree data structure is built to describe it efficiently. To convert a 3D sprinkler system to a tree structure, the drops and pipe joints are defined as nodes, whereas the pipes are defined as the links between the nodes, as shown in Figure 7. The damage states of the drops and pipes are recorded at the corresponding nodes.

Fig. 7. A tree data structure for a sprinkler system

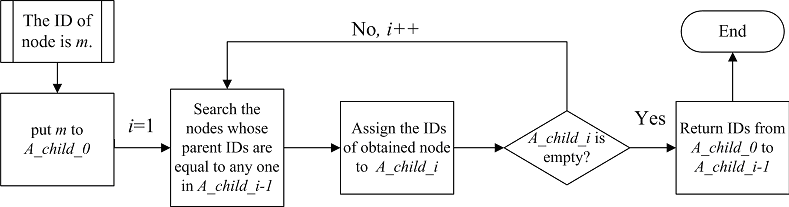
In a sprinkler system, a damaged component (e.g., a pipe) will affect all the other connecting components in the inflow direction. Identifying all the affected components is equivalent to searching for all the child nodes of the damaged node. Thus, a dual-ID traversal algorithm is designed for searching the child nodes in a tree structure (see Figure 8). Specifically, each child node stores two types of IDs: its own ID and the IDs of its parents. If the ID of the node corresponding to the damaged component is m, all its child nodes can be found through the following algorithm:

Fig. 8. Proposed dual-ID traversal algorithm for searching child nodes

Step 1: assign m to a new array named A_child_0. Set i = 1.

Step 2: search for all the nodes whose parent IDs are equal to any ID in A_child_i-1, and assign the IDs of these identified nodes to a new array, A_child_i. Repeat Step 2 until A_child_i is empty.

Step 3: return all IDs from A_child_0 to A_child_i-1. The nodes corresponding to these IDs then become all the child nodes of node m.

(2) Overall damage state of the sprinkler system

First, the nodal damage states in a sprinkler system are determined, i.e., different damage states are assigned to the nodes in the tree structure of the sprinkler system. If the total number of nodes of a certain type of sprinkler component on a story is n, the numbers of DS1 and DS2 for this type of node (i.e., nds1 and nds2 in Eqs. (3) and (4), respectively) on that story can be calculated according to the damage probabilities obtained using Eqs. (1) and (2).


nds1 = n ℅ P(DS1)

(3)


nds2 = n ℅ P(DS2)

(4)

According to nds1 and nds2, damage states DS1 and DS2 are randomly assigned to the nodes.

For a given nodal damage state, the overall damage state of a sprinkler system is determined based on the traversal of the child nodes. If a component is at DS2 (i.e., it is completely damaged), it will cause all its connecting components in the inflow direction to become out-of-service, which implies that all the child nodes of this node will also enter DS2. If a component is at DS1, the quantities of flow of this component and all its connecting components in the inflow direction will be reduced, suggesting that all the child nodes of this node will also reach DS1. Specifically, if a pipe and drop are at DS1, their design quantities of flow qp and qd can be calculated from Eqs (5) and (6) [21], respectively,


qds1,p = qp(1 0.02 ℅ L/20)

(5)


qds1,d = qd(1 0.01)

(6)

where qds1,p and qds1,d are their quantities of flow at DS1, respectively, and L is the length of the damaged pipe in units of ft.

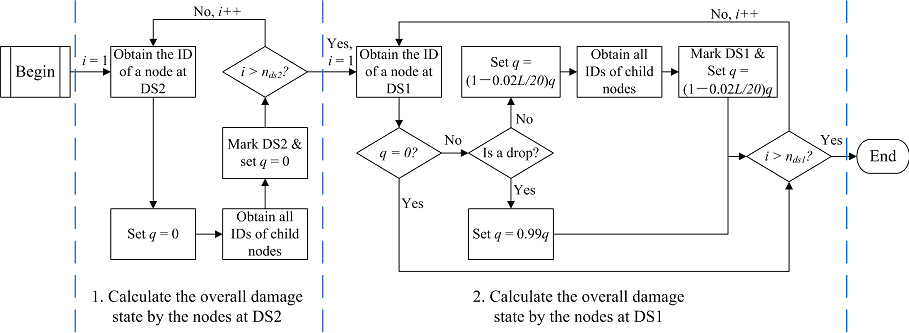
The overall damage state generated by the node at DS2 is first calculated (see Figure 9) based the following algorithm:

Fig. 9. A method for determining the overall damage states of a sprinkler system

Step 1: obtain the ID of one of the nodes at DS2 (the total number of the nodes at DS2 is nds2).

Step 2: visit this node in the database and set its quantity of flow as zero (i.e., q = 0).

Step 3: obtain all the IDs of its child nodes using the proposed dual-ID traversal algorithm (Figure 8).

Step 4: mark the damage states of the child nodes as DS2 and set their quantities of flow as zero.

As the total number of nodes at DS2 is nds2, the above four steps are performed nds2 times.

Next, the overall damage state generated by the nodes at DS1 is calculated (see Figure 9) based on the following algorithm:

Step 1: obtain the ID of one of the nodes at DS1 (the total number of the nodes at DS1 is nds1).

Step 2: check if the quantity of flow of this node is equal to zero (i.e., q = 0?). If q = 0, no calculation is required and return to Step 1; otherwise, go to Step 3.

Step 3: check if the component corresponding to this node is a drop or pipe. If it is a drop, set q = 0.99 q according to Eq. (6) and return to Step 1; if it is a pipe, set q = (1 0.02 ℅ L/20)q according to Eq. (5) and go to Step 4. Here, L denotes the length of this pipe.

Step 4: obtain the IDs of all the child nodes of this pipe using the proposed dual-ID traversal algorithm (Figure 8);

Step 5: visit all the child nodes. Mark their damage states as DS1 and set q = (1 0.02 ℅ L/20)q, which implies that the quantities of the flow of all the child nodes will also be reduced because the quantity of the flow of the parent node is reduced by the seismic damage.

The above five steps are performed nds1 times for the total number of nds1 nodes at DS1.

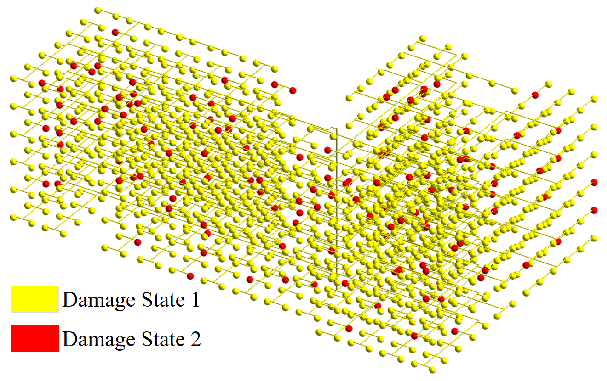
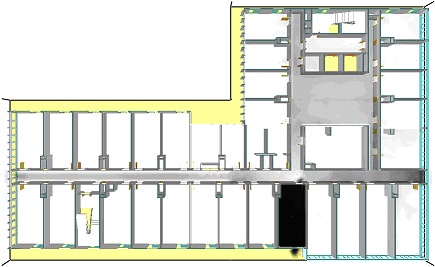
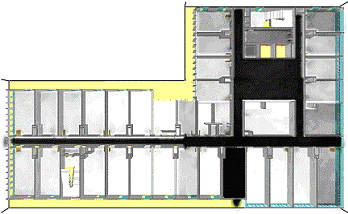
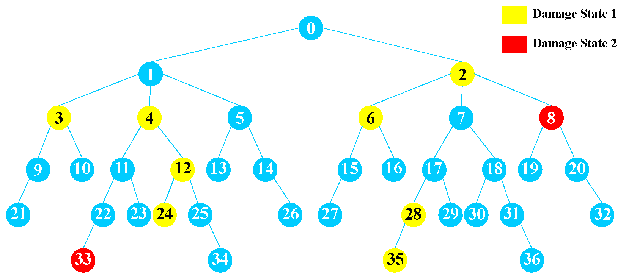
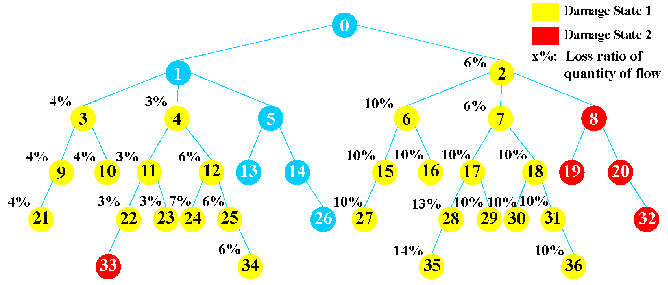
By using the proposed method (Figure 9), the corresponding overall damage state of a sprinkler system can be predicted based on the nodal damage state, and both are illustrated in Figure 10. It can be seen that there are obvious differences between Figures 10(a) and 10(b) because the damage states of the child nodes can be affected by their damaged parent nodes.

(a) Nodal damage state

(b) Overall damage state

Fig. 10. Nodal damage state and the corresponding overall damage state

(3) Worst overall damage state of a sprinkler system

Because the nodal damage state of each component is randomly assigned, the corresponding overall damage state of the associated sprinkler system is also random. The worst overall damage state of a sprinkler system is required to be identified for a conservative seismic design. Theoretically, the Monte Carlo method can be adopted to obtain the worst state, but numerous calculations are inevitable. Hence, a method based on the critical nodes that have the most child nodes is proposed to calculate the worst overall damage state of a sprinkler system.

The damage of sprinkler components can be represented by the loss ratio of the quantity of flow (denoted as qloss). For example, if a component is at DS2, qloss = 100%. Therefore, the total qloss of a sprinkler system is selected as the index for determining the worst state of the overall damage. According to FEMA P-58, each story is an elemental object for predicting the seismic damage of sprinkler components, and thus, the worst state needs to be calculated story-by-story. Let the total number of stories of a building be Ns. The calculation should be gradually implemented story-by-story from the ground to the top of the building because the damage in the lower story may cause all its upper stories to also be damaged.

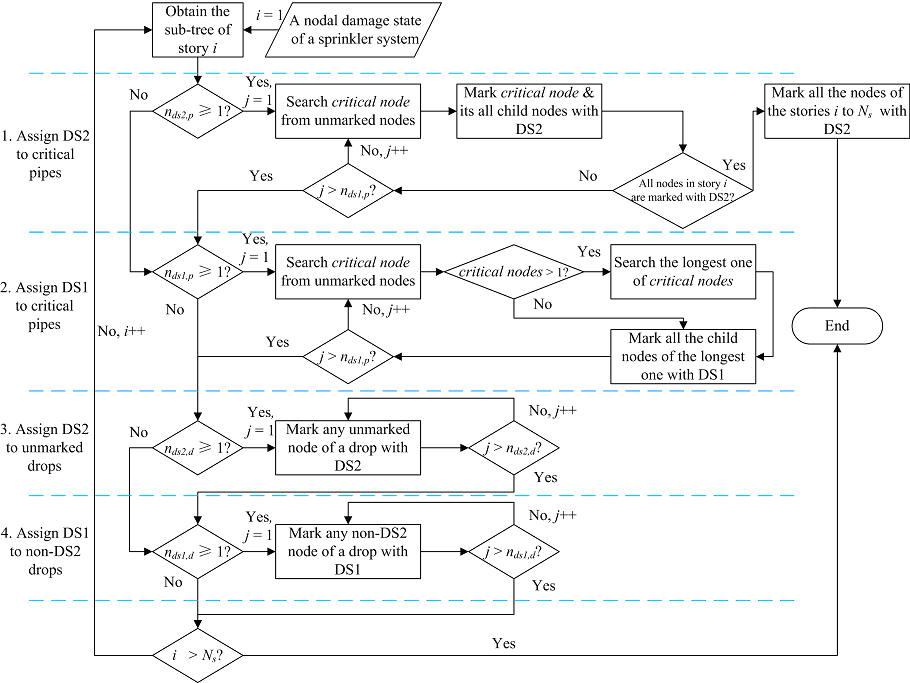
On each story, the severest damage states are preferentially assigned to the critical nodes defined as having the most child nodes, so that the worst damage state of a story can be determined. Let nds2,p and nds1,p represent the number of pipes at DS2 and DS1 on a story, respectively, and let nds2,d and nds1,d represent the number of drops at DS2 and DS1 on a story, respectively. The proposed two-ID traversal algorithm is used to identify the critical nodes, using which the worst damage state on a story is determined (Figure 11). This method of identifying the critical nodes is described by the following algorithm:

Fig. 11. A method based on critical nodes for determining the worst overall damage case

Step 1: Assign DS2 to the critical pipes

If nds2,p = 0, no pipes are at DS2. Then go to Step 2. If nds2,p > 0, the critical node is repeatedly determined from the unmarked nodes and is marked with DS2 together with all its child nodes (See Figure 11). Note that if the nodes with the most child nodes are not unique, any one of them is randomly selected as the critical node. Note also that if all the nodes on a story are marked with DS2, both the sprinkler system on this story and all the sprinkler systems above this story will be considered be totally damaged.

Step 2: Assign DS1 to critical pipes

If nds1,p = 0, go to Step 3; if nds1,p ≡ 1, the critical node will be repeatedly determined from the unmarked nodes on the story concerned and be marked with DS1 together with all its child nodes. If the number of nodes having the most child nodes are more than one, the one with the longest pipe is selected as the critical node because the longest pipe yields the maximum loss of quantity of flow (see Eq.(5)).

Step 3: Assign DS2 to unmarked drops

In contrast with the pipes, the damage of the drops does not affect the other components in the sprinkler system, and thus, any unmarked drop node is randomly assigned to DS2.

Step 4: Assign DS1 to non-DS2 drops

The states of DS1 are assigned to any drop nodes, except those marked with DS2.

When the assignment of the damage states to all the stories is completed, the overall worst damage states of a building will be determined.

3. Case study

3.1 High-fidelity modeling based on BIM

A six-story reinforced-concrete frame dormitory building was selected to perform the case study, and its 3D BIM was built using Revit, as is shown in Figure 12. On each story, there are 214 sprinkler drops with a diameter of 20 mm. For each drop, the designed quantity of flow is 80 L/min, and the activated temperature is 68 ∼C. The BIM of the sprinkler system was also generated using Revit. The planar layout of the sprinkler system on each story is identical, as shown in Figure 13.

Fig. 12. 3D BIM of the dormitory building

Fig. 13. Planar layout of the sprinkler system on each story

The FDS models of the building and its sprinkler system are constructed using the proposed methods presented in Section 2.2. Specifically, a high-fidelity FDS model of the building is generated from the BIM using PyroSim, and subsequently, the material information is added to the FDS model (Figure 14) using the developed FDS_BUILD program. The FDS model of the sprinkler system is generated based on the developed BIM_SPRK and FDS_SPRK programs, as displayed in Figure 15.

Fig. 14. High-fidelity FDS model of the building

Fig. 15. FDS model of the sprinkler system

3.2 Seismic damage prediction

The seismic response of the building is predicted via a nonlinear THA. In this study, the El-Centro 1940 ground motion [29], recorded in the 1940 El Centro earthquake in southern California with a magnitude of 6.9, is adopted because it is widely-used as a benchmark input for THA. According to the Chinese seismic design code [30], the peak ground acceleration (PGA), corresponding to an exceedance of 2%/50 years, is 510 cm/s2 in the area where the building is located, and so, the El-Centro 1940 ground motion with a PGA of 510 cm/s2 is used as the input for the THA. The damage states and PFAs of all the stories obtained from the nonlinear THA of the building are listed in Table 2.

Table 2 Seismic damage data of the dormitory building

Story

Damage State

PFA (m/s2)

1

Moderate damage

5.14

2

Slight damage

5.52

3

Slight damage

5.84

4

Slight damage

5.93

5

Slight damage

5.68

6

Slight damage

5.81

The simulation results indicate that the building will not collapse under the given ground motion. Specifically, the ground story is moderately damaged, whereas the 2nd to 6th stories are slightly damaged. The PFAs are found to vary from 5.14 to 5.93 m/s2, with a maximum PFA of 5.93 m/s2 recorded on the 4th story. According to these PFAs, the seismic damage states of the pipes and drops can be calculated by using the fragility curves of FEMA P-58, with the results listed in Table 3.

Table 3 Seismic damage of the sprinkler components

Story

Pipes


Drops

Quantity

Probability of DS1

Probability of DS2


Quantity

Probability of DS1

Probability of DS2

1

884

4%

0%


214

36%

7%

2

884

5%

0%


214

41%

9%

3

884

6%

0%


214

44%

11%

4

884

6%

0%


214

45%

12%

5

884

6%

0%


214

43%

10%

6

884

6%

0%


214

44%

11%

Using the methods proposed in Section 2.4, the worst overall damage state of the sprinkler system is obtained, as shown in Figure 16. This damage state will be used by FDS to perform the fire simulation.

Fig. 16. The worst overall damage state of the sprinkler system

3.3 Post-earthquake fire simulation

Numerous published research studies [31每34] confirm that the results of the FDS-based fire simulations agree well with the experimental data. Hence, in this study, we expect the post-earthquake fire simulations performed using FDS to be effective. To consider the spread of fire in both the horizontal and vertical directions, fire is assumed to be ignited in a room on the fifth story, as shown in Figure 17. In this room, a total of six drops are completely damaged. The combustibles being ignited are two 2.0 m 1.5 m mattress made of sponge and a knitted fabric (See Figure 18), undergoing polyurethane reactions [35]. A multi-grid technique, which refines the story on fire, is employed in FDS to improve the simulation accuracy. Specifically, the grid size of the story on fire (i.e., the 5th story) is refined to 0.25 m ℅ 0.25 m ℅ 0.25 m, whereas that of the other stories remains as 0.5 m ℅ 0.5 m ℅ 0.5 m.

Fig. 17. Ignited room and key locations

Fig. 18. Details of the ignited room

The fire simulation time was 500 s, which is almost the same as the required safe evacuation time (RSET) of this building calculated by the FDS+Evac tool [36]. As shown in Figure 17, the ignited room (labeled as 5-I) is directly associated with fire initiation and propagation, whereas two staircases (labeled as 5-S1 and 5-S2) and the lobby (labeled as 5-L) are critical areas for evacuations, and so, they are selected as the four key locations in this study. The fire data (e.g., temperature, soot density, and fractional effective dose (FED)) of these key locations are monitored during the fire simulation. Note that the FED [37, 38] is a widely-used indicator of the concentration of the toxic gases in the combustion systems. Two simulation scenarios are performed according to the damage states of the sprinkler system: no seismic damage and with predicted seismic damage, hereafter denoted as ※non-damage§ and ※predicted damage§, respectively.

3.4 Simulation results

(1) Fire spread in the horizontal direction

The overall distribution of smoke on the fifth story under both non-damage and predicted damage scenarios is illustrated in Figure 19 when the fire is fully developed (300 s). It can be seen that owing to the seismic damage of the sprinkler system, the generated smoke in the predicted damage scenario occupies more rooms than that in the non-damage case.

(a) Non-damage scenario

(b) Predicted damage scenario

Fig. 19. Comparision of smoke distributions between two scenarios on the 5th story

The overall distribution of temperature in both the scenarios is presented in Figure 20. It can be seen that the maximum temperature in the non-damage scenario is approximately one third of the predicted damage scenario. Note that the temperatures of the other rooms are not significantly increased, except that of the ignited room, which is also evident from Figure 20.

(a) Non-damage scenario

(b) Predicted damage scenario

Fig. 20. Comparision of temperature distributions between two scenarios on the 5th story

To quantitatively analyze the effect of the seismic damage, the simulation results of the key locations are compared under the two scenarios. Figure 21 shows the time-history responses of the temperature, soot density, and FED in the ignited room (Location 5-I) in both the scenarios.

(a) Temperature curves at Location 5-I

(b) Soot density curves at Location 5-I

(c) FED curves at Location 5-I

Fig. 21. Quantitative comparisons between two scenarios in the ignited room (Location 5-I)

It can be seen from Figure 21(a) that the sprinkler system in the ignited room begins to function at approximately 100 s. The room temperature of the non-damage scenario decreases sharply after that, indicating that the non-damaged sprinkler system can extinguish the fire efficiently. However, the room temperature of the predicted damage scenario does not exhibit the same level of abrupt decrease, suggesting that the fire cannot be completely extinguished by the damaged sprinkler system. Significant differences similar to the temperature variations are also observed in the soot densities and FEDs from Figures 21(b) and 21(c) owing to the effect of the damaged sprinkler system. 

Because no significant temperature variation is found outside the ignited room, only the soot density and FED of the other key locations are compared in Figures 22每24. From these figures, it can be seen that the starting time of the spreading of smoke is notably different at these key locations. Considering the soot density curves in the predicted damage scenario, Location 5-L (i.e., the lobby) is closest to the ignited room (See Figure 17), and so, the starting time of the spread of smoke is the shortest (50 s). Although Location 5-S2 is closer to the ignited room than Location 5-S1 (See Figure 17), the spread of the smoke at Location 5-S2 (150 s) owing to the delaying effect caused by its surrounding walls, starts later than that at Location 5-S1 (90 s). In addition, the values of the soot density and FED in the predicted damage scenario are obviously larger than those in the non-damage scenario at all these key locations. Given that the soot density and FED are important indices for the safe evacuation of the building occupants, the seismic damage of a sprinkler system will cause more severe injuries and deaths in case of high-occupancy buildings.

(a) Soot density curves at Location 5-S1

(b) FED curves at Location 5-S1

Fig. 22. Quantitative comparisons between two scenarios at Location 5-S1

(a) Soot density curves at Location 5-S2

(b) FED curves at Location 5-S2

Fig. 23. Quantitative comparisons between two scenarios at Location 5-S2

(a) Soot density curves at Location 5-L

(b) FED curves at Location 5-L

Fig. 24. Quantitative comparisons between two scenarios at Location 5-L

(2) Fire spread in vertical direction

Because the ignited room is located on the fifth story, fire and smoke may spread to the sixth story through the windows, doors, and staircases. Figure 25 shows the smoke distributions on the sixth story in the two scenarios at 300 s. In the predicted damage scenario, the spread of smoke is found to cover two adjacent rooms on the sixth story. In contrast, in the non-damage scenario, smoke only occupies one room. In addition, the smoke is obviously denser in the predicted damage scenario than in the non-damage scenario.

(a) Non-damage scenario

(b) Predicted damage scenario

Fig. 25. Comparision of smoke distributions between two scenarios on the 6th story

The soot density and FED curves in the two scenarios in a room (labeled as 6-I) immediately above Location 5-I are depicted in Figure 26. The values of the soot density and FED in the predicted damage scenario are obvious higher than those in the non-damage scenario.

(a) Soot density curves at Location 6-I

(b) FED curves at Location 6-I

Fig. 26. Quantitative comparisons between two scenarios at Location 6-I

As described above, this case study reveals that a damaged sprinkler system can cause more severe fire hazards in both the horizontal and vertical directions.

4. Conclusions

In this study, a post-earthquake fire simulation method considering the overall seismic damage of a sprinkler system was proposed. As a case study, the spreading process of a post-earthquake fire in a six-story dormitory building was simulated. Based on this study, the following conclusions can be drawn:

(1) Using the designed modeling method, high-fidelity FDS models of the buildings and their sprinkler systems can be created based on BIM.

(2) Seismic damage probabilities of different sprinkler components can be predicted based on FEMA P-58. Subsequently, the overall seismic damage of the sprinkler system can be predicted using a developed tree data structure. The worst damage state of the sprinkler system can be determined based on the proposed method of critical nodes.

(3) The proposed simulation method can quantify the effects (including temperature, soot density, and FED) caused by the seismic damage of a sprinkler system on fire spreading.

It is worth noting that the widely used El-Centro 1940 ground motion with an amplified PGA of 510 cm/s2 is adopted in the case study to demonstrate the simulation capability of the proposed method for post-earthquake fires. For a particular real-world building, specific ground motions reflecting the regional tectonic setting, geology, and seismicity should be selected to generate the earthquake damage scenario to fully represent the post-earthquake fire performance of the specific building.

Acknowledgements

The authors are grateful for the financial support received from the Beijing Natural Science Foundation (No.8173057).

References

[1] X.Z. Lu, X. Zeng, Z. Xu, H. Guan. Physics-based simulation and high-fidelity visualization of fire following earthquake considering building seismic damage, Journal of Earthquake Engineering (2017). DOI: 10.1080/13632469.2017.1351409.

[2] C. Scawthorn, T.D. O'Rourke, F.T. Blackburn. The 1906 San Francisco earthquake and fire: enduring lessons for fire protection and water supply, Earthquake Spectra 22 (S2) (2006) s135每s158. DOI:10.1193/1.2186678

[3] T. Nishino, S.I. Tsuburaya, K. Himoto, T. Tanaka. A study on the estimation of the evacuation behaviors of Tokyo city residents in the Kanto Earthquake Fire: development of a potential-based evacuation model in post-earthquake fire, Fire Safety Science, 74 (636) (2009) 105每114. DOI:10.3801/IAFSS.FSS.9-453

[4] S.A. Architect. Lessons from the Great Hansin-Awaji Earthquake. http://www3.grips.ac.jp/~ando/HanshinLessons%20en.pdf, Aug 8, 2016.

[5] T. Tanaka. Characteristics and problems of fires following the great east Japan earthquake in March, Fire Safety Journal 54 (2011) 197每202. DOI:10.1016/j.firesaf.2012.07.002

[6] A. Sekizawa, M. Ebihara, H. Notake. Development of seismic-induced fire risk assessment method for a building, Fire Safety Science 7 (2003) 309每320. DOI: 10.3801/IAFSS.FSS.7-309

[7] J.T. Jeon, W.Y. Jung, B.S. Ju. Evaluation of seismic performance of 2-story fire protection sprinkler piping system, Journal of The Korean Society of Disaster Information 10(3) (2014) 458每464. DOI:10.15683/kosdi.2014.10.3.458

[8] S. Soroushian, A.E. Zaghi, E. Maragakis, A. Echevarria. Seismic fragility study of displacement demand on fire sprinkler piping systems, Journal of Earthquake Engineering 18(7) (2014) 1129每1150. DOI:10.1080/13632469.2014.917059

[9] T. Yuan, A. Filiatrault, G. Mosqueda. Seismic response of pressurized fire sprinkler piping systems I: experimental study, Journal of Earthquake Engineering 19(4) (2014) 674每699. DOI:10.1080/13632469.2014.994147

[10] K.B. McGrattan, R.J. McDermott, C.G. Weinschenk, G.P. Forney. Fire Dynamics Simulator, Technical Reference Guide, Sixth Edition. https://www.nist.gov/publications/fire-dynamics-simulator-technical-reference-guide-sixth-edition, Mar 8, 2016.

[11] L.Y. Ding, Y. Zhou, B. Akinci. Building information modeling (BIM) application framework: the process of expanding from 3D to computable nD, Automation in Construction 46 (2014) 82每93. DOI:10.1016/j.autcon.2014.04.009

[12] Autodesk. Revit: Built for BIM. http://www.autodesk.com/products/revit-family/overview, Sep 2, 2016.

[13] MagiCAD. BIM with MagiCAD. https://www.magicad.com/en/, Sep 7, 2016.

[14] J. Wang, X.Y. Wang, W.C. Shou, H.Y. Chong, J. Guo. Development of BIM-based evacuation regulation checking system for high-rise and complex buildings, Automation in Construction 46 (2014) 38每49. DOI:10.1016/j.autcon.2013.12.005

[15] Thunderhead Engineering. PyroSim. http://www.thunderheadeng.com/pyrosim/, Sep 20, 2016.

[16] C. Jenkins, S. Soroushian, E. Rahmanishamsi, E. Maragakis. Experimental fragility analysis of pressurized fire sprinkler piping systems, Journal of Earthquake Engineering 21(1) (2016) 6286. DOI: 10.1080/13632469.2016.1157528.

[17] T. Yuan, A. Filiatrault, G. Mosqueda. Seismic response of pressurized fire sprinkler piping systems II: numerical study, Journal of Earthquake Engineering 19(4) (2014) 674每699. DOI:10.1080/13632469.2014.994148

[18] A. Filiatrault, G. Mosqueda, R. Retamales, R. Davies. Experimental seismic fragility of steel studded gypsum partition walls and fire sprinkler piping subsystems, in: S. Senapathi, K. Casey, M. Hoit (Eds.), Structures Congress 2010, American Society of Civil Engineers, Orlando, Florida, USA, May 1215, 2010, (369) 2633每2644. DOI:10.1061/41130(369)237

[19] S. Soroushian, A.E. Zaghi, M. Maragakis, A. Echevarria, Y. Tian, A. Filiatrault. Analytical seismic fragility analyses of fire sprinkler piping systems with threaded joints, Earthquake Spectra 31(2) (2015) 1125每1155. DOI:10.1193/083112EQS277M

[20] Federal Emergency Management Agency. Seismic Performance Assessment of Buildings Volume 1 每 Methodology, https://www.fema.gov/media-library-data/1396495019848-0c9252aac91dd1854dc378feb9e69216/FEMAP-58_Volume1_508.pdf, Feb 4, 2016.

[21] Federal Emergency Management Agency. Seismic Performance Assessment of Buildings Volume 2 每 Implementation Guide,https://www.fema.gov/media-library-data/1396495019848-0c9252aac91dd1854dc378feb9e69216/FEMAP-58_Volume2_508.pdf, Feb 6, 2016.

[22] X. Zeng, X.Z. Lu, T. Yang, Z. Xu. Application of the FEMA-P58 methodology for regional earthquake loss prediction, Natural Hazards 83(1) (2016) 177每192. DOI: 10.1007/s11069-016-2307-z

[23] K. Shaw, E. Ioup, J. Sample, M. Abdelguerfi, O. Tabone. Efficient approximation of spatial network queries using the M-Tree with road network embedding, in: P. Kellenberger (Eds.), International Conference on Scientific and Statistical Database Management, IEEE, Banff, Alta., Canada, July 9每11, 2007. DOI:10.1109/SSDBM.2007.11

[24] D. Dobersek, D. Goricanec. Optimisation of tree path pipe network with nonlinear optimisation method, Applied Thermal Engineering 29(8) (2009) 1584每1591. DOI:10.1016/j.applthermaleng.2008.07.017

[25] Dynamo. Dynamo BIM. http://dynamobim.org/, Sep 16, 2016.

[26] Microsoft. SQL Server 2016. https://www.microsoft.com/en-us/sql-server/sql-server-2016, Nov 9, 2016.

[27] X. Lu, X.Z. Lu, H. Guan, L.P. Ye. Collapse simulation of reinforced concrete high-rise building induced by extreme earthquakes, Earthquake Engineering & Structural Dynamics 42(5) (2013) 705每723. DOI:10.1002/eqe.2240

[28] C. Xiong, X.Z. Lu, X.C. Lin, Z. Xu, L.P. Ye. Parameter determination and damage assessment for THA-based regional seismic damage prediction of multi-story buildings, Journal of Earthquake Engineering 21(3) (2017) 461每485. DOI:10.1080/13632469.2016.1160009

[29] O. Cundumi, L. Su芍rez. Numerical investigation of a variable damping semiactive device for the mitigation of the seismic response of adjacent structures, Computer-Aided Civil and Infrastructure Engineering 23 (2008) 291每308. DOI:10.1111/j.1467-8667.2007.00537.x

[30] Ministry of Housing and Uran-Rual Development of P.R. China. Code for Seismic Design of Building (GB 50011-2010), China Architecture Industry Press, Beijing, P.R. China, 2016. ISBN: 1511228896. (in Chinese)

[31] S. Olenick, D. Carpenter. An updated international survey of computer models for fire and smoke, Journal of Fire Protection Engineering 13(2) (2003) 87每110. DOI:10.1177/1042391503013002001

[32] N. Ryder, J. Sutula, C. Schemel, A. Hamer, B. Van. Consequence modeling using the fire dynamics simulator, Journal of Hazardous Materials 115(1每3) (2004) 149每154. DOI:10.1016/j.jhazmat.2004.06.018

[33] J. Clement, C. Fleischmann. Experimental verification of the fire dynamics simulator hydrodynamic model, Fire Safety Science 7 (2003) 839每850. DOI:10.3801/IAFSS.FSS.7-839

[34]G.W. Zou, W.K. Chow. Evaluation of the field model, fire dynamics simulator, for a specific experimental scenario, Journal of Fire Protection Engineering 15 (2) (2005) 77每92. DOI:10.1177/1042391505047304

[35] K. McGrattan, S. Hostikka, R. McDermott, J. Floyd, C. Weinschenk, K. Overholt. Fire Dynamics Simulator User*s Guide (Sixth Edition). http://ws680.nist.gov/publication/get_pdf.cfm?pub_id=913619, May 3, 2016.

[36] T. Korhonen, S. Hostikka. Fire Dynamics Simulator with Evacuation: FDS+Evac - Technical Reference and User*s Guide. http://lovreglio.altervista.org/FDS_EVAC_Guide.pdf, May 7, 2016.

[37] J. K.Hong, S.Y. Bae, Y.K. Choi, K.B. Hong, S.R. Hong. Numerical analysis on the effect of improved fractional effective dose (FED) for evacuation by fds_evac, Journal of the Korean Society of Safety 28(1) (2013) 125131. DOI: 10.14346/JKOSOS.2013.28.1.125

[38] Z. Xu, X.Z. Lu, H. Guan, C. Chen, A.Z. Ren. A virtual reality based fire training simulator with smoke hazard assessment capacity, Advances in Engineering Software 68 (2014) 1每8. DOI:10.1016/j.advengsoft.2013.10.004


* Corresponding author.

E-mail address: xuzhen@ustb.edu.cn (Z. Xu), zhangzcai@qq.com (Z.C. Zhang), luxz@tsinghua.edu.cn (X.Z. Lu), cengx13@mails.tsinghua.edu.cn (X. Zeng), h.guan@griffith.edu.au (H. Guan).

Introduction
Research
Application
Teaching
Publications
Download
Issues
Others


Our Lab

Collapse Prevention Committee