|
4.1
Buildings of Beijing CBD
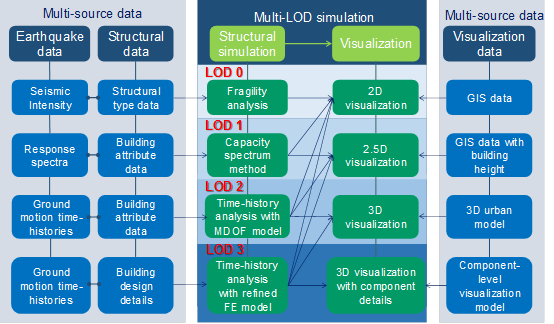
In this section, Beijing CBD is investigated to demonstrate the proposed multi-LOD
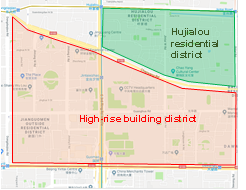
simulation framework. Beijing CBD is highly suited for performing the case
study because of the different types of buildings in this area, including
not only super-tall and regular high-rise buildings (Fig. 5a)
but also a residential area with dense multi-story buildings (Fig. 5b).
|

|
|
(a) Oblique
view of buildings in Beijing CBD
|
|
|
|
(b) Map
of Beijing CBD
|
Fig. 5 Buildings in Beijing CBD
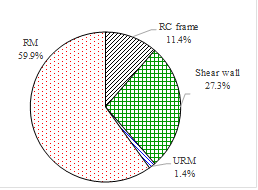
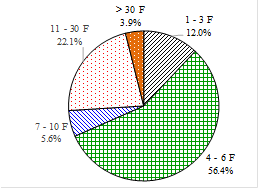
The distributions of the structural type and building stories of the area according
to statistics are shown in Fig. 6.
Evidently, most of the buildings in this area are reinforced masonry (RM)
structures with 4¨C6 stories because of dense residential buildings in the
Hujialou district.
|
|
|
|
(a) Structural
type distribution
|
(b) Building
story distribution
|
Fig. 6 Building distributions
of Beijing CBD
To facilitate the multi-LOD simulation, the structural and visualization
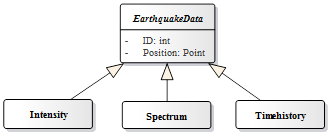
data of Beijing CBD are obtained in advance. The acquisition of earthquake
data is discussed in the subsequent section.
4.2
Earthquake data of Beijing CBD
The adopted earthquake data are mainly based on the ground motion
simulation performed by Fu (2012). In FuˇŻs
study, the 3D basin structure of Beijing area is modeled
using a 3D velocity structure model. The ground motion sets of all Beijing
CBD buildings are obtained using the finite difference method for the M8.0
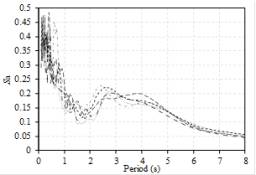
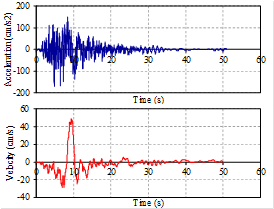
Sanhe¨CPinggu earthquake scenario. Typical response spectra, acceleration/velocity
time histories of the buildings in Beijing CBD are illustrated in Fig. 7. As presented in Fig. 7b, the ground motions of the
Sanhe¨CPinggu earthquake contain a significant velocity pulse, which is very
destructive to the buildings in Beijing CBD.
|
|
|
|
(a)
Typical response spectra
|
(b)
Typical acceleration/velocity time history
|
Fig. 7 Typical ground motions of M8.0 Sanhe¨CPinggu
scenario in Beijing CBD
To examine the effect of different ground motions on the results of
the multi-LOD simulation, two additional ground motions (namely, El-Centro
without velocity pulse and CHICHI_CHY101-N with velocity pulse) (PEER 2013) were selected.
Further, the peak ground acceleration (PGA) was adjusted to 1.580 m/s2,
which is the typical PGA of the Sanhe¨CPinggu ground motions given in Fig. 7b.
In addition, in order to perform the LOD 0¨C1 simulation, seismic
intensity and response spectrum data are obtained based on the ground motion
time-history data presented above.
4.3
LOD 0 simulation
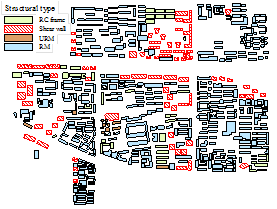
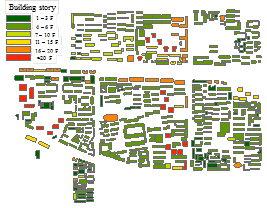
Given that the LOD 0 simulation is more applicable to multi-story
buildings, the LOD 0 simulation is performed for the Hujialou residential
district. The buildings of the Hujialou district consist of reinforced concrete
(RC) frame, RM, unreinforced masonry (URM), and shear wall structures. The
structural type and building story distribution in the Hujialou residential
district are illustrated in Fig. 8.
|
|
|
|
(a)
Structural type distribution
|
(b)
Building story distribution
|
Fig. 8 Buildings of the Hujialou residential district
Seismic intensity data are required as earthquake
input for the LOD 0 simulation. According to the research of Ding et
al. (2017), the PGA of a region with
the Chinese seismic intensity scale of VII ranges from 118 to 219 cm/s2.
Note that the PGA of the Hujialou residential district under the M8.0 Sanhe¨CPinggu
scenario falls in this range (Fig. 7).
Thus, the seismic intensity of VII is used for the following fragility analysis.
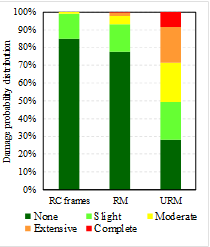
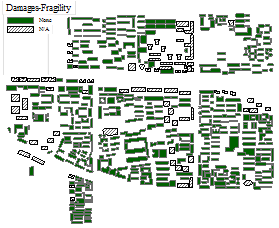
Given such an intensity, the seismic-damage results can be obtained according
to the damage probability matrices for different types of Chinese buildings
recommended by Yin (1996), as
shown in Fig. 9. Fig. 9a presents the probability distribution of different damage states for
the RC frame, RM, and URM structures. The damage state of maximum probability
of each building is displayed using the LOD 0 visualization based on
2D-GIS data, as shown in Fig. 9b.
Note that the earthquake data used for the LOD 0 fragility analysis
is the seismic intensity level, and the seismic results of the Sanhe¨CPinggu,
Chichi, and El-Centro earthquakes are the same because their seismic intensities
are identical.
|
|
|
|
(a)
Damage probability distribution
|
(b)
LOD 0 visualization using 2D-GIS data
|
Fig. 9 Seismic-damage results of the LOD 0
simulation
The advantages and disadvantages of the LOD 0 simulation can be summarized as
follows:
(1) The structural seismic damage can be easily obtained using damage
probability matrices, and the analysis can be completed within 1 second for
514 multi-story buildings in the Hujialou residential district. Furthermore,
the simulation only requires the structural type and seismic intensity data,
which are easy to obtain in urban-scale simulations.
(2) The differences in the frequency and duration of ground motions
cannot be considered in the LOD 0 simulation. Hence, the predicted seismic-damage results
of the Sanhe¨CPinggu, Chichi, and El-Centro earthquakes are the same.
(3) The variation in the seismic performance of different individual buildings cannot
be considered in the LOD 0 simulation. Thus, different buildings of the
same structural type have the same seismic-damage result.
(4) Due to the lack of fragility data from previous earthquake events,
the LOD 0 simulation is not performed for shear wall high-rise structures
in this region, and these buildings are labeled with ˇ°N/Aˇ± (Fig. 9b).
4.4
LOD 1 simulation
The capacity curves of the buildings can be obtained according to the building
attribute data and performance database for different types of buildings (FEMA 2012; Lu et al. 2014). Then, according to the
response spectra of the Sanhe¨CPinggu, El-Centro, and Chichi earthquakes (Fig. 10), the seismic-damage results
of the buildings in the Hujialou residential district can be obtained through
the LOD 1 CSM. The computation of all 514 multi-story buildings consumes
10.2 CPU seconds on a desktop computer (with Intel i5-4590 CPU @3.30 GHz and
8GB RAM). The results are displayed in Fig. 11 using the LOD 0 visualization with 2D-GIS data.
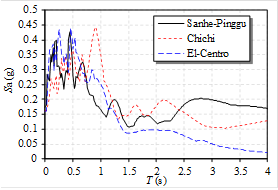
Fig. 10 Response spectra of three ground motion
records
|
|
|
|
(a)
Sanhe¨CPinggu
|
(b)
Chichi
|
|

|
|
(c) El-Centro
|
Fig. 11 Seismic-damage results of the LOD 1
simulation
The advantages and disadvantages of the LOD 1 simulation can be
summarized as follows:
(1) Building attribute data
are required as the building data; thus, the simulation is relatively easy
to implement at the city level.
(2) The CSM of the LOD 1
simulation takes into account the amplitude and frequency-domain characteristics
of the ground motion. Hence, the results of the Sanhe¨CPinggu and Chichi earthquakes
vary. However, the results of the Sanhe¨CPinggu and El-Centro earthquakes are
the same. The reason is that although the ground motion time-history records
of these two earthquakes are different, the response spectra within the range
of 0¨C2 s are similar. The LOD 1 simulation based on the CSM cannot fully
consider the time-domain properties of ground motions.
(3) The CSM
of the LOD 1 simulation simplifies each building to a SDOF model, which
is not appropriate for high-rise buildings. Therefore, the LOD 1 simulation
is not performed herein for the shear wall high-rise structures in this region,
which were also labeled with ˇ°N/Aˇ± in Fig. 11. In addition, when a building is severely damaged, its vibration mode
shape may change. Hence, the SDOF model of the CSM is not applicable. Further
discussion will be presented in the subsequent section.
4.5
LOD 2 simulation
According to the attribute data of regional buildings, the method of Xiong et al.
(2016; 2017) is adopted to generate the MDOF model of each building. Subsequently,
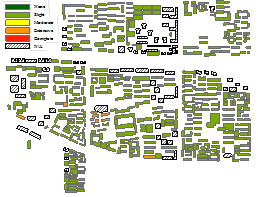
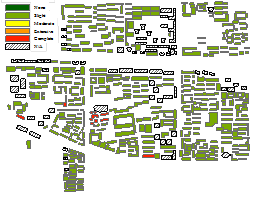
the LOD 2 seismic-damage simulation is performed using a nonlinear THA.
The THA of all buildings in the Hujialou residential district consumes 80.2
CPU seconds on a desktop computer (with Intel i5-4590 CPU @3.30 GHz and 8
GB RAM). The results are presented in Fig. 12.
|
|
|
|
(a)
Sanhe¨CPinggu
|
(b) Chichi
|
|
|
|
(c)
El-Centro
|
Fig .12 Seismic-damage results of the LOD 2
simulation
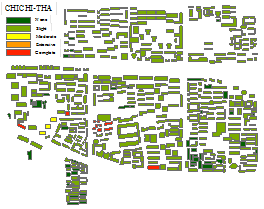
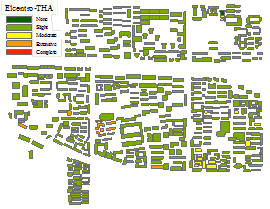
As shown in Fig. 12, the results of different
earthquakes are varied, thus indicating that the LOD 2 level simulation
can also consider the characteristics of various ground motions. Both the
Sanhe¨CPinggu and Chichi earthquakes have velocity pulses. Hence, the seismic
damages of several buildings subjected to these two earthquakes are more severe
than that of the El-Centro earthquake.
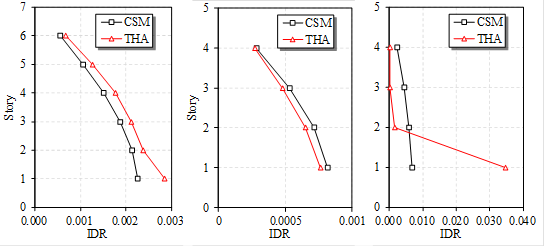
To compare the features of the LOD 1 (CSM) and LOD 2 (THA) simulations
in more detail, a typical RC frame, RM, and URM structures are analyzed using
the LOD 1 and LOD 2 methods. As shown in Figs. 13a and 13b, the inter-story
drift ratio (IDR) results indicate that the damages of the RC frame and RM
structures are relatively small, and the mode shapes have not changed significantly.
Therefore, the calculated results of the CSM and THA methods agree well to
each other. However, the URM structure is severely damaged, and the damage
concentration occurs in the first story, as shown in Fig. 13c. In this case, the mode shape of the LOD 2 simulation (THA) changes
significantly, and the prediction results of the LOD 1 (CSM) and LOD 2
(THA) simulations vary remarkably.
|
|
|
(a) RC
frame
|
(b)
RM
|
(c)
URM
|
Fig. 13 Comparison of the LOD 1 and LOD 2
simulations for an individual building subjected to the Sanhe¨CPinggu earthquake
Thus, the LOD 2 simulation has the following advantages and disadvantages:
(1) The structural data required for the LOD 2 simulation are basically the same
as those for the LOD 1 simulation. Hence, the simulation is easy to implement
at the city level.
(2) The LOD 2 simulation can better reflect the seismic performance
of different individual buildings, and the frequency-/time-domain characteristics
of various ground motions.
(3) The LOD 2 simulation adopts the MDOF model. Hence, the variation
of the mode shape caused by damage concentration can be satisfactorily considered.
(4) The computational workload of the LOD 2 simulation is relatively
large compared with that of the LOD 0¨C1 simulation, and the ground motion
time-history records of an entire region are difficult to obtain. Therefore,
several difficulties may be encountered when applying this method to large
cities under emergency circumstances.
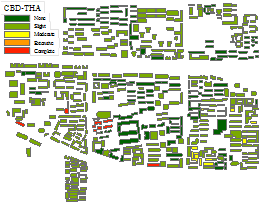
The seismic-damage results of the LOD 2 simulation can be presented
using the LOD 0¨C2 visualization methods. Fig. 12
shows the result of the LOD 0 visualization by using 2D-GIS data. The
LOD 0 visualization is very simple. Thus, the damage distribution of
buildings in a region can be clearly presented. Fig. 14a shows the LOD 1 visualization. This visualization method can
be used to present 3D seismic-damage scenes showing the story-level results
(such as the displacement or damage state of each story). Fig. 14b presents the LOD 2 visualization, which can more realistically
display the façade of each building and the 3D scene of the entire
urban area.
|
|
|
|
(a) LOD 1
visualization
|
(b)
LOD 2 visualization
|
Fig. 14 LOD 1¨C2 visualization methods
4.6
LOD 3 simulation
The nonlinear dynamic characteristics of high-rise buildings and super-tall
buildings are complex. Hence, using the LOD 0 and LOD 1 methods
to simulate the nonlinear seismic response of high-rise buildings is difficult.
In Section 4.5, the MDOF flexural shear model (Xiong et al. 2016) is adopted in the LOD 2
simulation to compute the seismic responses of regular high-rise buildings,
which can not only obtain the flexural shear behavior of high-rise buildings
but also consider the influence of high-order vibration modes to the structure.
Apart from the regular high-rise buildings, Beijing CBD also houses a large
number of super-tall buildings with more complex nonlinear dynamic characteristics.
Owing to the existence of outriggers or strengthening stories, the assumption
of the MDOF flexural shear model (Xiong et al. 2016) that a continuous stiffness distribution along the building height
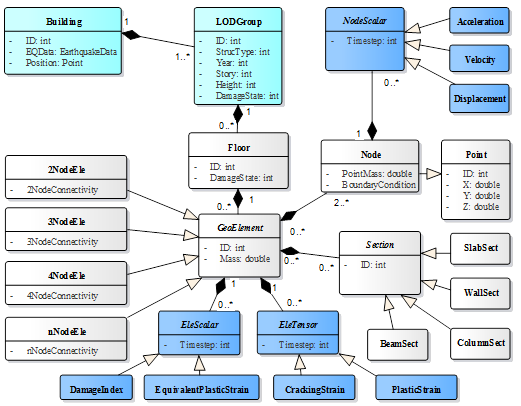
is no longer applicable. Therefore, a refined FE model is adopted herein in
the LOD 3 simulation to represent the complex buildings. In the refined
FE model, fiber beam elements are used to simulate the nonlinear performance
of the beam and column components, and multi-layered shell elements are adopted
to simulate the shear wall components. The fiber beam and multi-layered shell
elements (Lu et al. 2013) have been proven to effectively evaluate the seismic performance of
high-rise buildings and super-tall buildings, and have been extensively
used in seismic-damage and collapse simulations of such building types.
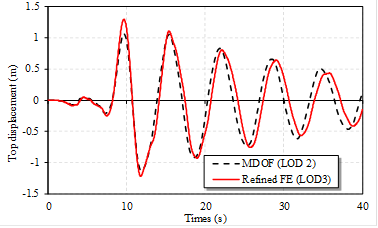
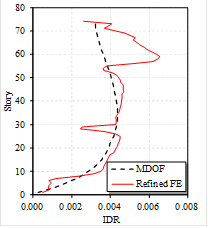
To demonstrate the LOD 3 simulation method, the 74-story
China World Trade Center (CWTC) tower is simulated
using the LOD 2¨C3 methods. The time-history responses of the top story
and IDR results are shown in Fig. 15. As presented in the figure,
the time-history responses of the two methods are in good agreement (Fig. 15a), but the IDR results are
slightly different (Fig. 15b). The reason is that the
CWTC tower has outriggers and perimetric trusses on several stories, which
can effectively reduce the IDR on these stories. Moreover, the LOD 3
simulation by using the refined FE model can comprehensively cover such design
details. The LOD 3 simulation of the super-tall building consumes 26,452
CPU seconds, whereas the LOD 2 simulation consumes only 64 CPU seconds
(with Intel i5-4590 CPU @3.30 GHz and 8 GB RAM). In addition, detailed design
information is required to establish a LOD 3 model. Therefore, the LOD 3
simulation can be applied to a small number of special buildings.
|
|
|
|
(a)
Time-history responses
|
(b)
IDR
|
Fig. 15 Results of the CWTC tower by using the LOD 2
and LOD 3 simulations
In summary, the LOD 3 simulation has the following advantages
and disadvantages:
(1) The refined FE model of the LOD 3 simulation can appropriately
reproduce the complex seismic performance of special buildings.
(2) The detailed design information is required for the LOD 3
simulation and its modeling, and the computational workload is excessive.
Therefore, the LOD 3 simulation can be applied to a small number of special
buildings with complicated seismic performance.
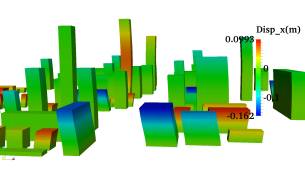
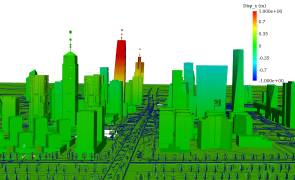
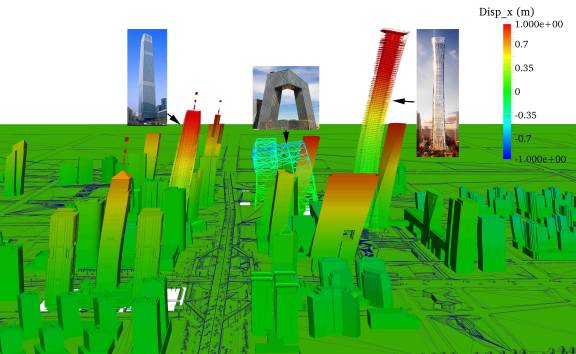
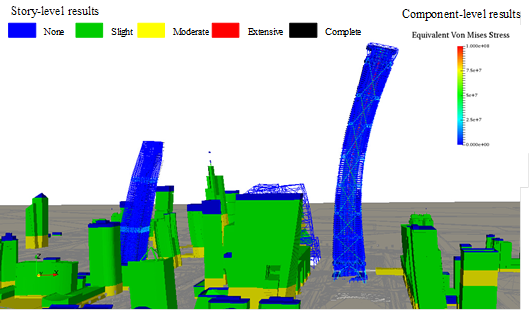
The LOD 3 visualization by using the component-level building
data is performed to display the seismic-damage results of Beijing CBD high-rise
building district, as shown in Fig. 16.
Note that only three buildings possess the component-level building data.
These three super-tall buildings are displayed using the LOD 3 visualization,
and all the other buildings are presented using the LOD 2 visualization.
Unlike the LOD 2 visualization shown in Fig. 14b, the LOD 3 visualization method is able to present the seismic
responses (Fig. 16a) and damage states (Fig. 16b) of each building at the
component level.
|
|
|
(a)
Displacement contour of Beijing CBD by using the LOD 2¨C3 hybrid
visualization
|
|
|
|
(b)
Damage states of Beijing CBD by using the LOD 2¨C3 hybrid visualization
|
Fig. 16 LOD 2¨C3 hybrid visualization
5 Conclusions
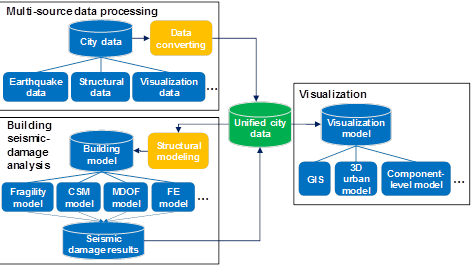
A multi-LOD urban-building
seismic-damage simulation framework, as well as its implementation method,
are proposed in this study. The multi-LOD simulation
framework can make a full utilization of the multi-source data, simulate various
types of structures, and meet the requirements of different simulation scenarios.
Through a case study of the Beijing CBD, the features of different LOD simulation
methods can be summarized as follows:
(1) The
LOD 0 simulation can yield a probabilistic result for various structural
types, and this method is the easiest one to implement. However, the influences
of different earthquakes are not considered.
(2) The LOD 1 simulation can reasonably obtain the nonlinear properties
of multi-story buildings and
consider the frequency-domain characteristic of earthquakes. Nevertheless,
the CSM of the LOD 1 simulation uses a fixed vibration mode shape that
cannot simulate the soft story failure of multi-story buildings. Furthermore,
the CSM is based on a SDOF simulation, which is not applicable for high-rise
buildings.
(3) The LOD 2 simulation based on the THA of a MDOF model can
comprehensively reflect the seismic performance of regular buildings and the
frequency-/time-domain characteristics of ground motions. However, the MDOF
model cannot simulate the component-level details of complex structures, such
as super-tall buildings.
(4) The LOD 3 simulation based on the THA of a refined FE model
is the most accurate method. Nevertheless, the required computational
time is more than 400 times that needed by the LOD 2 method for the case
of the CWTC tower.
By considering the
features of all the LOD simulation methods, the proposed multi-LOD simulation
framework enables a flexible selection of the appropriate LOD simulation method
under various circumstances, which may facilitate future applications of urban-building
seismic-damage simulations for complex cities.
|