Improving the accuracy of near-real-time seismic loss estimation using post-earthquake remote sensing images

Xinzheng Lu,a) Xiang Zeng,a) Zhen Xu,b) and Hong Guanc)

Earthquake Spectra,
Accepted 20 January, 2018. DOI: 10.1193/041417EQS072M

Download PDF Full Text


With the rapid development of remote sensing technology, satellite or aerial images from the disaster area become available within 24 hours after an earthquake. The collapsed buildings can be easily identified from these images. In this work, a framework for near-real-time seismic loss estimation for regional buildings is proposed, which improves the accuracy of nonlinear time-history analysis (THA)-based loss estimations by taking advantages of the identified building collapse scene of the disaster area. Specifically, a series of THA are performed for the target regional buildings, thereby generating a number of simulation results. Those simulation results that bear strong similarities to the identified collapse scene are identified as the optimal solutions, which will be used to estimate the seismic loss. The simulation results of the case studies signify that the use of the identified building collapse scene leads to much closer estimations to actual economic losses.

Introduction

Rapid and accurate estimation of the building seismic loss is of great value to the development of a rational disaster relief and reconstruction plan. Existing methods to estimate building seismic loss mainly include those: (1) through site investigation (Masi et al. 2016); (2) using seismic loss estimation models (Erdik et al. 2011, Jaiswal and Wald 2011); and (3) using remote sensing image data (Dong and Shan 2013). Method (1) is relatively most accurate, yet time-consuming. Site investigation often takes weeks or even months, and very labor intensive. Hence this method cannot adapt to the needs of timely post-earthquake loss assessment. Methods (2) and (3), on the other hand, are much time-efficient, hence have been widely used in rapid earthquake loss assessment (Yeh et al. 2006, Vu and Ban 2010).

The loss estimation models (i.e., Method (2)) can be used for estimating building seismic loss of a large area, in particular. Given correct seismic inputs and building fragility models, the loss estimation models can take account of the influence of different damage states (e.g., slight, moderate, extensive and collapse) on the building seismic loss. The regional loss estimation models have undergone three stages of development (Lu and Guan 2017): (1) the damage probability matrix method, e.g. ATC (1985) and Yin (1996); (2) the capacity spectrum method, e.g. FEMA (2012a); and (3) the nonlinear time-history analysis (THA)-based method, e.g. Hori (2011), Lu et al. (2014), Xiong et al. (2016, 2017). Certain limitations exist with respect to the first two stages, such as difficulty in considering the influence of higher modes of vibration of the buildings and the ground motion characteristics (Zeng et al. 2016, Xiong et al. 2017). The THA-based method overcomes these limitations, but the rationality of its estimation depends largely on the quality of the input parameters (i.e., building information and ground motion time history). If there happens to be no seismic station near the disaster area, the selection of ground motion input should be carefully considered (Kalkan and Chopra 2010).

By using satellite or unmanned aerial vehicle (UAV), remote sensing images of the disaster area can be obtained soon after an earthquake. The collapsed and non-collapsed buildings can then be identified by analyzing the images (Gusella et al. 2005, Ehrlich et al. 2009), so as to rapidly identify the building collapse scene of the disaster area. Nevertheless, it is difficult to identify the damage inside the buildings from the available images, resulting in an underestimation of the seismic loss (Rathje and Adams 2008). Although quite a few studies attempted to recognize more refined damage states using aerial images, so far the accuracy of identification remains relatively low. For example, studies show that the accuracy of identifying “extensively damaged” buildings is merely 20%~30% (Yamazaki et al. 2005, Rathje and Adams 2008). Therefore, to date identifying the collapse status of a building is technically more mature and reliable than identifying refined damage states.

Overall, using the THA-based regional seismic loss estimation method, the seismic loss of buildings with different damage states can be obtained easily, but the reliability of the estimated loss is largely affected by the quality of the input parameters. When lacking proper ground motion input, the accuracy of the estimation will be significantly reduced. On the other hand, remote sensing image analysis is able to reliably identify the collapsed buildings in a timely manner, but the estimation accuracy for non-collapsed buildings is relatively low. Therefore, it is logical to combine the advantages of the THA-based method and the remote sensing image analysis techniques, so as to improve the accuracy and reliability of the loss estimation. To achieve this objective, a possible solution is proposed herein: When lacking rational ground motions as input, a large quantity of (e.g., thousands of) ground motions with different intensities and time histories are selected as input, and a series of THA are performed, generating a suite of simulation results. Simultaneously, the building collapse scene of the disaster area can be identified via remote sensing image analyses. Among the suite of simulation results, those that bear strong similarities to the remote sensing collapse scene are identified as the optimal solutions, which will subsequently be used to estimate the seismic loss. One of the key issues is how to select the optimal simulation results. To address this issue, a framework of such a near-real-time seismic loss estimation is described, and two methods for selecting the optimal simulation results are proposed in this work. Validation is performed using a simulated 1730 Western Beijing earthquake and the actual 2014 Ludian earthquake in China, by which the advantages of the proposed method are demonstrated.

Framework of near-real-time seismic loss estimation

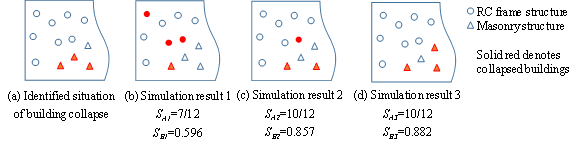
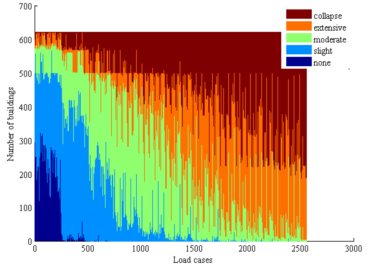
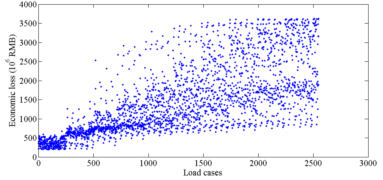
The proposed framework of seismic loss estimation of regional buildings, incorporating the THA-based method and post-earthquake remote sensing image analysis techniques, consists of five components (Figure 1). (1) Identify collapsed and non-collapsed buildings by analyzing the post-earthquake remote sensing images, so as to obtain the building collapse scene of the disaster area. (2) Generate a large number of seismic analysis load cases. For example, use a large number of ground motions with different intensities and time histories as input. (3) Perform regional seismic damage simulation for each load case, resulting in a suite of simulation results. These results not only include the information of the collapse status of the building, but also include different damage states (i.e., none, slight, moderate, or extensive damage). (4) From the suite of simulation results, identify those that are mostly similar to the identified collapse scene as the optimal. (5) Estimate the seismic loss of the building using the optimal simulation results.

Much of the existing studies can be referred to for Components (1), (3), and (5). For the integrity of presentation, they are briefly introduced herein without detailed discussions. Note that Component (4) is one of the main focuses of this study, in which two similarity measures of building collapse distributions are proposed. Component (2) is also briefly described. It should also be noted that the framework proposed in this work (Figure 1) is generic and adaptable, i.e., each of the five components can be implemented through alterative means, not limiting to the implementation described in this work.

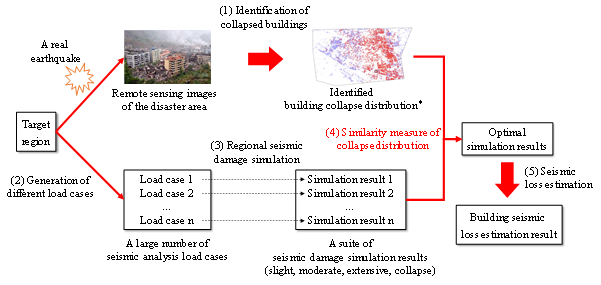
Figure 1. The framework proposed in this work. *Source of the building collapse distribution image: Gusella et al., (2005)

Identification of collapsed buildings

There exist many approaches to identify collapsed and non-collapsed buildings from the post-earthquake remote sensing images. For example, through crowdsourcing, the images are distributed to a group of people and collapsed buildings can be rapidly identified by human intelligence (Xie et al. 2016). Using image classification techniques (Li et al. 2014), collapsed / non-collapsed buildings can also be automatically identified.

It should be noted that existing studies on collapsed building identification from remote sensing images demonstrate the likelihood of having some omission errors (i.e. false negative rate). For example, Booth (2011) reported a 42% omission error in identification of the collapsed buildings during the 2010 Haitian earthquake; Yamazaki (2005) reported a 37.5% omission error for the 2003 Bam Earthquake, Iran. Notwithstanding, some published literature also show that the omission error can be reduced by using ancillary data (e.g. vector map of buildings), multi-perspective, and oblique images (Dong and Shan 2013). For example, Samadzadegan and Rastiveisi (2008) combined the QuickBird images and building vector maps for collapsed building identification subsequent to the 2013 Bam earthquake, leading to a reduced omission error of 25%; Turker and Cetinkaya (2005) used digital elevation models for the 1999 Izmit earthquake, Turkey, and the omission error was reduced to 16%. Therefore, identifying collapsed buildings from remote sensing images is both feasible and achievable.

Nevertheless, identifying non-collapsed damage states is a more challenging task. For instance, Foulser-Piggott (2016) attempted to identify the red tagged or yellow tagged non-collapsed buildings from the 2011 Christchurch earthquake, and the omission error was found to be 56%~86%. Note that currently there is no feasible solution to effectively reduce such an error.

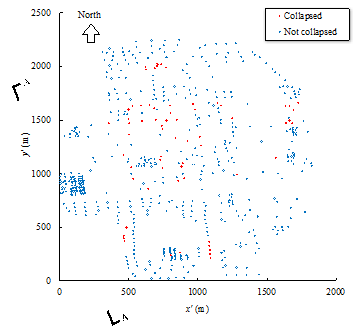
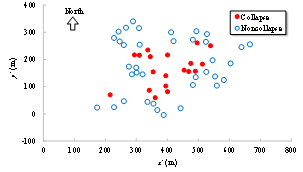
Given the accuracy of the current remote sensing image identification techniques, this work thus suggests identifying collapse (rather than other refined damage states) from the remote sensing images. Extensive research and practical applications of remote sensing technologies have been well summarized and documented in several review articles (Rathje and Adams 2008, Dong and Shan 2013). As such, related topics are not discussed herein in detail. With respect to the case study of the 2014 Ludian earthquake presented in this work, the UAV aerial images from the China Earthquake Administration and news media, together with the building vector map were used. Visual interpretation (Dong and Shan 2013, Xie et al. 2016) was performed to identify the collapse situation of 56 buildings in the disaster area by human intelligence. Hence the identified collapse is consistent with the actual collapse situation.

It should be noted, however, that regional seismic loss estimation is a challenging issue. This work proposed an alternative approach, which is most suitable for cases with sufficient accuracy in collapse identification. With potential advancement of the remote sensing techniques, the omission errors are expected to be further reduced. For cases when the omission errors are significant, the predicted seismic loss will be underestimated, which would require further studies to be undertaken.

Generation of different load cases

The rationality of the THA results is influenced by (a) the building data, (b) the building models and parameters, and (c) the ground motion inputs. Firstly, with the advances in technologies such as big data and smart city, abundant urban building data become available (Qi et al. 2017). Secondly, with respect to the building models and parameters, the regional seismic damage simulation method developed by Xiong et al. (2016, 2017) with satisfactory modeling accuracy is adopted in this study. Thirdly, Lu et al. (2017) studied the uncertainty of the parameters of the structural models (e.g. the yield point, peak point, and soft point at the inter-story backbone curves) and its influence on the regional seismic damage simulation. Their results demonstrate that, assuming the parameters of the structural models of different buildings are independent, the uncertainty of those parameters has a small influence on the overall analysis results of a region. As a result, only ground motion uncertainty is considered when generating different load cases in this study. Therefore, the uncertainty of ground motion becomes the dominant factor influencing the accuracy of the THA results. Published studies also confirm that the randomness in structural seismic responses is mainly attributable to the uncertainty of the ground motion in particular when the seismic intensity is large (Kwon and Elnashai 2006).

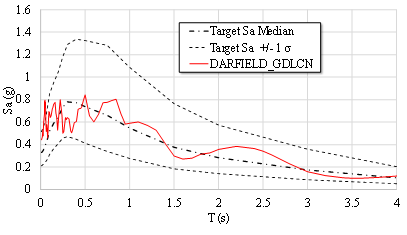
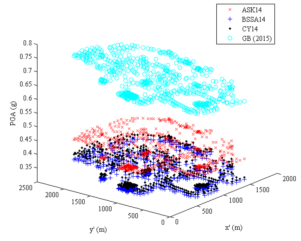
In order to obtain a suitable ground motion input, the following strategy is adopted in this work: a number of different ground motions are used as input, so as to generate a series of THA load cases; then determine which ground motion input yields the building collapse results that are most similar to the identified collapse. For a region lacking sufficient ground motion input, a total of p different ground motion prediction equations (GMPE) are adopted, and a total of q ground motion records are selected for each GMPE, hence generating n = pq load cases.

Regional seismic damage simulation

In terms of regional seismic damage simulation, the method proposed by Xiong et al. (2016, 2017) is adopted in this work. In Xiong et al.’s study, low- and mid-rise buildings are simulated using the multiple degree-of-freedom (MDOF) shear model, while tall buildings are simulated using the MDOF flexural-shear model. Such numerical models of buildings are computationally very efficient. Based on the design process specified in the Chinese design codes and abundant experimental data, Xiong et al. (2016, 2017) proposed a model parameter determination method for reinforced concrete (RC) frame, reinforced masonry, unreinforced masonry, and RC tall buildings in China. With this method, the numerical models of buildings can be automatically established using basic building information (i.e. floor area, number of stories, height, structural type, construction period, and function). Xiong et al. (2016, 2017) compared the simulated building responses with the results of refined finite element models and experimental data. The comparisons validated the accuracy of the MDOF model and THA. For regions beyond China, it is suggested to use other parameter determination methods that are suitable for the particular region, such as the model parameter determination methods based on the HAZUS-database proposed by Lu et al. (2014) for the buildings in the United States.

Xiong et al. (2017) considered five different damage states, i.e., none, slight, moderate, extensive and collapse. For different structural types, different damage criteria were proposed. It is assumed that when the inter-story force or displacement exceeds a certain threshold, the structure reaches a corresponding damage state. Different from the fragility curves, such a threshold-based damage assessment is a deterministic approach. Xiong et al. (2017) compared the predicted damage states with the actual building seismic damage during the 2014 Ludian earthquake. Overall, the simulation agrees well with actual damage (Table 1). As a result, the parameters for damage assessment were treated as deterministic in this study.

Table 1. Comparison between the predicted damage states and actual damage states (Xiong 2017).

2 level

underestimate

1 level

underestimate

Identical

1 level

overestimate

2 level

overestimate

Percentage number of buildings

0

14%

52%

34%

0

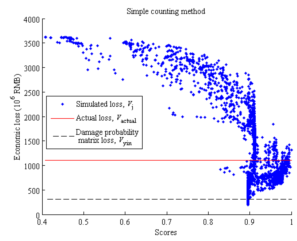
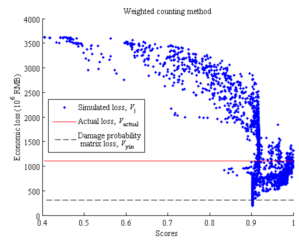
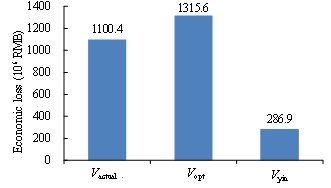
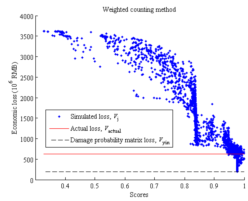
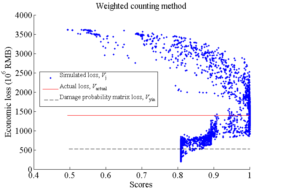
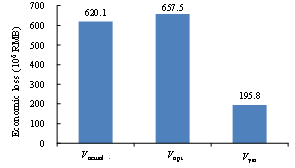
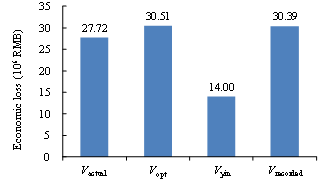
With respect to the soil-structure interaction (SSI) effects, for regular-height buildings on normal soils (not extremely soft), the SSI will not affect the structural responses significantly. It should be noted that in the proposed method, the simulated building collapse scenes are compared with the collapse scene identified from the remote sensing images of the disaster area. As a result, when evaluating the most suitable load cases, the SSI and the site-city interaction (SCI) effects are implicitly considered. Specifically, the identified optimal ground motion should be the one closest to the actual ground motion that is inputted to the building, which includes the SSI and SCI effects, instead of a free field ground motion without any SSI or SCI effects. This is supported by the result of Ludian earthquake validation in this study which shows that the estimated loss using the proposed method, Vopt, agrees well with the actual loss, Vactual. For the sites with soft soils or densely distributed high-rise buildings, studies show that the SSI and the SCI effects become more complex (Semblat et al. 2008, Isbiliroglu et al. 2015, Smerzini 2017). The shape and the attenuation of ground motions on such site may significantly differ from any ground motions or GMPEs specified for generating the simulated scenarios. In view of the above, it would be worthwhile to conduct further study and extend the applicability of the proposed method to cover the aforementioned cases.

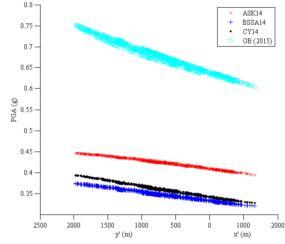
Currently, the distributions of peak ground acceleration (PGA) or intensity (denoted as Shakemap) are widely used for loss estimations. For example, Huyck (2016) used ImageCat images to deduce the PGA Shakemap, and estimated the seismic loss based on ATC 13 (ATC 1985), which is a form of the damage probability matrix method (stage (1) of Method (2) described in Section “Introduction”). However, Shakemap relies on macroseismic intensities and empirical seismic damage observations, resulting in an average and subjective description of the hazard (Lang et al. 2012). Consequently, it may lead to considerable errors in replicating the actual seismic damage of individual structures. In addition, Shakemap mainly represents the amplitude of ground motions. Further, some other characteristics (e.g. duration and spectrum) of the ground motion input are difficult to be considered using Shakemap.

This study also compared the THA-based method and the damage probability matrix method. The damage probability matrix specific for Chinese buildings proposed by Yin (1996) is adopted in this study. This damage probability matrix has been widely used for the seismic loss estimation of past earthquakes in China. Note that the damage probability matrix method requires the use of the modified Mercalli intensity (MMI), and the relationship between PGA and MMI has shown to have a great uncertainty (Wald et al. 1999). In this work, the relationship suggested by the National Standard of China, “The Chinese seismic intensity scale” (GB/T 2008), is adopted, i.e. PGA of 0.09 g ~ 0.177 g corresponds to MMI of VII; PGA of 0.178 g ~ 0.353 g corresponds to MMI of VIII; and PGA of 0.354 g ~ 0.707 g corresponds to MMI of IX.

Similarity measure of collapse distribution

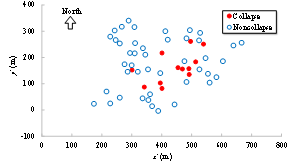
Among all the simulation results, in order to identify which one is most similar to the identified collapse distribution, each simulation result should be evaluated with a score. A higher score indicates a higher similarity with the identified collapse distribution, and those results with highest scores are identified as the optimal simulation results (Figure 2).

The similarity (or distance) measure quantifies the similarity between two objects, which plays an important role in pattern recognition, clustering, classification, and recommendation problems (Guo et al. 2013, Mahmoud 2011). In particular, binary similarity and distance measure is one of the most commonly used similarity measures. Since the building being of collapsed or non-collapsed is a binary event, the binary similarity and distance measure is thus considered in this work. Choi et al. (2010) summarized 76 binary similarity measures, including the widely used Jaccard similarity measure and Euclidean distance, etc. In this work, one of those measures is described in the Section “Evaluation of the similarity measure of collapse distribution” and denoted as the “simple counting method”. However, further discussions in that section show that binary similarity measures may not deliver reasonable outcomes for some cases. Hence the “weighted counting method” is proposed in this work taking into account the correction factors. Details are described in the Section “Evaluation of the similarity measure of collapse distribution”.

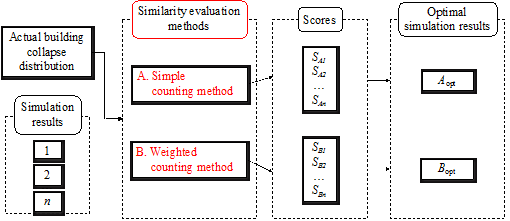
Figure 2. The flow chart of similarity measure of collapse distribution.

Seismic loss estimation

In this work, the building seismic loss is defined as the sum of the house damage loss Lh and decoration damage loss Ld. According to the National Standard of China, “Post-Earthquake Field Works-Part 4: Assessment of Direct Loss. (GB/T 2011)”, Lh and Ld are calculated using Eqs. (1) and (2), respectively:

(1)

(2)

where S is the building area (m2); Dh and Dd are the loss ratios of the house and decoration damages; given a damage state, their values are suggested in GB/T (2011), as shown in Table 2; P is the building replacement cost (RMB/m2, 1 RMB is approximately 0.145 USD in 2017), shown in Table 3 according to Yuan (2008); is the correction factor considering different economic conditions of different regions; is the building function correction factor; is the proportion of buildings with mid- to high-quality decoration; and is the ratio of the building decoration cost to the building construction cost. The values of can be referred to Table A.1~A.4 in GB/T (2011).

Table 2. Mean loss ratio of house damage and decoration damage under each damage state (GB/T 2011)

Damage state

None

Slight

Moderate

Extensive

Collapse

Loss ratio of house damage

3 %

11 %

31 %

73 %

91 %

Loss ratio of decoration damage

Reinforced concrete (RC)

6 %

18 %

43 %

81 %

96 %

Masonry

3 %

13 %

34 %

74 %

93 %

Table 3. Mean building replacement cost (Yuan 2008) Unit: RMB/m2

RC frame

Masonry

Masonry-wood

Adobe-wood

Frame shear wall

Shear wall

Rural

1200

825

550

425

-

-

Urban

1300

850

850

600

1400

1700

It should be noted that this approach, which mainly works for regions in China, is only one of the commonly used seismic loss estimation methods. Alternative equations, consequence functions, and replacement costs that are different from Eqs. (1) and (2), and Table 2 and Table 3 have been proposed in many other studies (Bal et al. 2008, FEMA 2012a, Chaulagain et al. 2016, Martins et al. 2016). In practice, different methods are applied to different regions other than those in China. Taking the regions in USA as an example, the consequence functions and replacement costs can be referred to Tables 15.2~15.6 and Table 3.6 provided in the HAZUS report (FEMA 2012a). As described above, using different seismic loss estimation methodologies will not change the conclusions of this work.

Evaluation of the similarity measures of collapse distribution

Two methods to evaluate the similarity measures of collapse distribution are proposed herein, as shown in Figure 2. Note that the two methods are independent from each other.

Method A, Simple counting method

Naturally, a simple yet effective method is to compare the simulated collapse results with the identified ones for each building. This idea is equivalent to the binary similarity measure defined by the Eq. (7) in Choi et al. (2010), denoted as “simple counting method” hereafter. Specifically: Let the random variable y be the collapse status of a building, where y obeys a Bernoulli distribution, i.e., y ~ B(1, p). y = 1 refers to collapsed building and y = 0 for non-collapsed building. For any simulation result i and any building j, let yij be the simulated collapse status of this building, and yj be the identified collapse status of the same building. Then the score is defined as

(3)

Let m be the total number of buildings, then the total score of the simulation result i is defined as

(4)

It can be seen from Eqs. (3) and (4) that the score of the simulation result, SAi, only takes account of the building collapse status. Other important building information, such as building location and structural type, is not considered. Hence the simple counting method may not be rational under some circumstances. Assuming a region consisting of 12 buildings, Figure 3 shows the identified situation of building collapse (Figure 3a) and three simulation results (Figure 3b to 3d), in which solid red legends denote the collapsed buildings. The identified collapse situation shows that all collapsed buildings are masonry structures, indicating that the masonry structures have higher collapse probability than RC frame structures in this earthquake. It can be seen that Simulation result 1 (Figure 3b), having the lowest score (SA1 = 7/12), is least similar to the identified collapse situation. This result is reasonable. Simulation result 2 (Figure 3c) indicates that a RC frame structure is collapsed, which is unlikely to happen according to the identified collapse situation, although the simulation score is as high as 10/12. Having the same score (i.e., SA3 = SA2), Simulation result 3 (Figure 3d) is obviously most similar to the identified collapse situation. This example demonstrates that the simple counting method is unable to identify the difference between the Simulation results 2 and 3.

Figure 3. Example showing the outcomes of the simple counting method and the weighted counting method.

Method B, Weighted counting method

The above discussions show that Eq. (4) should be modified by multiplying the correction factors, which are related to the collapse probability of different buildings. Note that different buildings exhibit different collapse probabilities, depending on the features and locations of the building. In view of this, the weighted counting method is proposed herein. The scoring rule is defined as follows.

(5)

(6)

where wbj and pj are the weighted factor and the collapse probability of building j, respectively. The total score of the simulation result i is defined as

(7)

At this point, the problem becomes how to calculate the collapse probability for each building. Let vector x be the determining factors for building collapse probability, and x comprises building location coordinates, structural type, construction type, number of stories, etc. Assuming

(8)

(9)

where q is the vector of factors to be calculated; the range of the logistic function h(z) is (0, 1). Eqs. (8) and (9) can be merged into a single equation:

(10)

Since the identified situation of building collapse is known, this information can be used to estimate q following the maximum likelihood principle, i.e., the value of q should maximize the value of pj of the collapsed buildings, and minimize the value of pj of the non-collapsed buildings. Therefore, solving q is equivalent to solving an optimization problem described by Eq. (11)

(11)

In practice, in order to avoid overfitting problem, Eq. (11) is often regularized by adding the regularization terms into Eq. (12), where l is a non-negative regularization parameter.

(12)

The above process described by Eqs. (10) to (12) belongs to a logistic classification (Bishop 2006), which represents a machine learning algorithm. The vector xj and identified collapse status yj of any building j make a training sample. The number of training samples is equal to the number of buildings, m. Generally, only a part of the training samples (e.g. 60%) are used as the training set to calculate the parameter vector q; another part of the training samples (e.g. 20%) are used for cross validation to determine the value of l; and the remaining training samples for testing the accuracy of the learning algorithm (Bishop 2006).

After solving q, the collapse probability of each building can be calculated using Eq. (8). Note that and the training samples are only related to the identified situation of building collapse, but not the simulation results.

As shown in Figure 3, SB3 of Simulation result 3 is higher than SB2 of Simulation result 2 using the weighted counting method. Therefore, the weighted counting method is more advantageous than the simple counting method.

Given proper training samples (not only collapse states but refined damage states), the machine learning method along could be used as a loss estimation basis. However, as described in Sections Introduction and “Identification of collapsed buildings” above, the accuracy of identifying non-collapsed damage states from remote sensing images is relatively low. Hence it is difficult to provide qualified training data. A possible solution would be to use field investigation data and statistics of building seismic damage of historical earthquake events. This might be a viable option. However, similar to the damage probability matrix method, for those regions lacking historical seismic damage statistics, further study is necessary to investigate whether the classifier trained via statistics of other regions can produce reasonable results.

Case study: a virtual earthquake occurring in Tsinghua University campus

Earthquake scenario

To further illustrate the performance of the above similarity evaluation methods, the campus of Tsinghua University (consisting of 619 buildings) in China is selected to conduct a case study. Detailed descriptions about the region can be found elsewhere in Zeng et al. (2016). A nearby strong earthquake event of 300 years ago was the 1730 Western Beijing earthquake. Given this event, a scenario based seismic damage simulation (FEMA 2012b) was performed, and denoted as the “target scenario”.

According to the literature, the magnitude of the 1730 Western Beijing earthquake was M6.5, the epicenter was approximately located at 40.0 ° N, 116.2 ° E (Huan et al. 1996), which is approximately 4.3 km from the center of Tsinghua Campus. As shown in Figure 4, the fault that caused this earthquake was F3 Qinghe Fault (Huan et al. 1996). Due to the lack of ground motion records of this ancient earthquake, one of the widely used GMPEs developed by the Next Generation Attenuation (NGA) research group, the CB14 model (Campbell and Bozorgnia 2014), was used in this work to calculate the target acceleration spectrum of the Tsinghua University campus. Note that the CB14 model is merely used to generate a simulated target scenario to compare the accuracy of different similarity measures. An actual earthquake scenario is used in the validation section of this work to further demonstrate the outcomes of the proposed method. Using the NGA-West2 online tool (Ancheta et al. 2014) provided by the Pacific Earthquake Engineering Research Center (PEER), a ground motion record that matches the target spectrum was selected as input (Figure 5). As the campus area (4km2) is not very large, the same ground motion record was used for every building for simplicity, but was scaled to different values of PGA using the CB14 model. Since the epicenter was in the northwest of the campus, the PGAs of the buildings at the northwest campus were higher than those at the southeast campus.

Figure 4. The isoseismal map of the 1730 M6.5 Western Beijing earthquake. Modified from Hua et al. (2005).

Figure 5. The target spectrum at the central campus and the spectrum of the selected ground motion.

Identification of collapsed buildings

Given the above ground motion input, different building seismic damage states of the “target scenario” is simulated. Then the building collapse distribution (Figure 6) of the “target scenario” is easily obtained from the simulated damage states. x’ and y’ indicate the building coordination. The positive directions of x’ and y’ axes point to the east and north, respectively.

Figure 6. The building collapse distribution of the “target scenario” (i.e. the 1730 M6.5 Western Beijing earthquake). A-A is a profile shown in Figure 7b.

Generation of different load cases

As described above, due to the lack of ground motion records and suitable GMPEs of the 1730 Western Beijing earthquake, 4 GMPE models were adopted, i.e., the BSSA14 (Boore et al. 2014), ASK14 (Abrahamson et al. 2014) and CY14 (Chiou and Youngs 2014) model proposed by NGA group, and the elliptical attenuation model proposed by the national standard of China (GB 2015). The distribution of the mean PGA values calculated from the four GMPEs is shown in Figure 7. It can be seen from the figure that within the target region, the PGA values are approximately linear to the building coordinates. However, the PGA values and the attenuation slope calculated by different GMPEs vary significantly, implying that only using the above four GMPEs may not generate a good simulation result that bears a strong similarity to the collapse distribution of the “target scenario”. Therefore, five linear attenuation functions as given in Eq. (13) were defined, where PGAmax represents the maximum PGA in the target area. The domain of PGAmax is {0.1 g, 0.2 g, ... 1.0 g}. Hence a total of 50 different GMPEs were defined using Eq. (13) (5 formulas, in which PGAmax takes 10 different values).

In total, 51 ground motion records were selected as input, including the widely used El-Centro 1940 ground motion, and the 22 far-field and 28 near-field ground motions proposed by the FEMA P695 report (FEMA 2009). Hence a total of 2550 different THA load cases were generated.

(a)

(b)

Figure 7. The mean PGA distributions calculated using four GMPEs, i.e., ASK14, BSSA14, CY14, and GB(2015). (a) Overlook. (b) Profile A-A in Figure 6.

(13)

It should be noted that a widely-used approach of ground motion selection is to adopt sufficient and proper GMPEs to calculate target spectra based on the source parameters of the particular earthquake, then select and scale the ground motion records accordingly. This approach involves two types of uncertainty, i.e., target spectra uncertainty (further classified as aleatory variability and epistemic uncertainty), and record-to-record uncertainty. If a target spectrum is well selected so that it is close to the actual spectrum, it can be used for the selection of ground motion records in the proposed method. Note that target spectra only represent the amplitude and spectrum of ground motions, the record-to-record uncertainty still exists given a target spectrum. As a result, the proposed method can be used to further reduce the record-to-record uncertainty.

However, due to the complexity of ground motion, the target spectra uncertainty could be large. For example, Figure 7 shows the mean PGA calculated by different GMPEs varies significantly. Hence the target spectra calculated using GMPEs may differ from the actual spectrum. As a result, a sufficient number of GMPEs are needed to fully address the target spectra uncertainty. For simplicity, a set of GMPEs are defined using Eq. (13) in this work. These GMPEs “cover” the results calculated using some widely used GMPEs shown in Figure 7. Hence it is expected that among those generated load cases, there is at least one case of which the simulation result is “similar” to the actual result. Other reasonable GMPEs can (and are encouraged to) be used in addition to those defined by Eq. (13), on the condition that the epistemic uncertainty is fully addressed. Note that quantifying the epistemic uncertainty requires a reasonable selection of multiple GMPEs with different branch weights (Kale and Akkar 2017). In this work, however, the purpose is not to quantify the ground motion uncertainty, but to obtain a set of ground motion input that can produce a reasonable loss estimation using the extra information (i.e. the identified collapse scene of the disaster area).

Overall, if the target spectra are well selected, they can then be used by the proposed method to reduce efforts of ground motion selection. And the proposed method can further reduce the record-to-record uncertainty. Otherwise, a sufficient number of GMPEs should be adopted to reflect the target spectra uncertainty.

Regional seismic damage simulation

By performing the above THA load cases, 2550 simulation results were generated. Each result contains building-level damage states. Figure 8a shows the number of buildings in each damage state of each load case. The load cases are sorted by seismic intensity, hence the damage generally becomes severer from load case 1 to 2550.

(a)

(b)

(c)

Figure 8. Simulation results for each load case. (a) Number of buildings in each damage states. (b) Similarity scores using the weighted counting method. (c) Estimated loss.

Similarity measure and seismic loss estimation

Using the proposed two similarity measures, the scores of each simulation result were calculated, and the optimal simulation results were identified. The economic loss corresponding to each simulation result was also calculated using Eqs. (1) and (2). The similarity scores (using weighted counting method) and estimated loss are shown in Figures 8b and 8c, respectively. In order to evaluate whether the calculated scores can effectively measure the similarity between the simulation results and the actual collapse distribution, the score-loss relationship is displayed in Figure 9. The blue dots in the figure represent the loss Vj for each simulation result j. The red solid lines denote the actual loss Vactual, which was calculated based on the damage states of the buildings under the target scenario. The black dashed lines signify the loss calculated using the damage probability matrix proposed by Yin (1996), Vyin. The figure illustrates that:

(1) The seismic loss Vj tends to converge towards the actual loss Vactual when the simulation scores are increased.

(2) The two methods of similarity measures are very close to each other. In particular, both methods lead to one optimal simulation result. The simulation score being ‘1’ indicated that the simulated building collapse distribution was exactly the same as that of the “target scenario” (Figure 6).

(3) The estimated economic loss of the optimal simulation result Vopt was 1315.6 million RMB (Figure 9c). Compared to the actual loss Vactual (1100.4 million RMB), the error was 19.6%. This implies a reasonably good estimation. The different between Vopt and Vactual is due to the different damage states of the non-collapsed buildings, though the distribution of collapsed buildings are the same.

(4) The seismic loss of the optimal simulation result was much better estimated than the loss Vyin (286.9 million RMB) using the damage probability matrix (Figure 9c). The damage probability matrix method greatly underestimates the seismic loss of the target scenario. This may be due to the fact that Beijing has not experienced strong earthquakes for nearly three hundred years. The rationality of a damage probability matrix relies on historical building damage statistics. Hence, this method may not accurately describe the seismic resistance of buildings in Beijing. In addition, the building seismic design code is continually being developed and the overall building seismic resistance is improving, which are difficult to be considered using historical seismic damage statistics.

(a)

(b)

(c)

Figure 9. The score-loss relationship of the simulation results (1730 Western Beijing earthquake). (a) Simple counting method (Method A). (b) Weighted counting method (Method B). (c) Comparison of simulated loss and actual loss.

Additional earthquake scenarios

To evaluate the performance of the proposed method at the other hazard levels, two additional earthquake scenarios were studied: While other source parameters remain unchanged, the magnitude of the 1730 Western Beijing earthquake was set to be (1) M5, and (2) M8. For the two target scenarios, the CB14 model is still used to calculate PGA of each building. The same 2550 load cases and their simulation results were used in which the optimal results would be selected. The similarity score and estimated loss are shown in Figure 10. The results of the two similarity measures are close, hence only the results of weighted counting method are shown. For the M5 scenario, 5 optimal simulation results with the highest score of 1.0 were identified (Figure 10a), the median loss of those simulation results were calculated as the estimated loss Vopt; while for the M8 scenario, 302 optimal simulation results with the highest score of 1.0 were identified. Figures 10c and 10d shows that in both the M5 and the M8 scenarios, Vopt is close to Vactual, being a much better prediction than Vyin using the damage probability matrix.

(a)

(b)

(c)

(d)

Figure 10. The results of the two additional earthquake scenarios. (a) The loss-score relationship of M5 scenario. (b) The loss-score relationship of M8 scenario. (c) Comparison of simulated loss and actual loss of M5 scenario. (d) Comparison of simulated loss and actual loss of M8 scenario.

The case studies of the three virtual scenarios (earthquake magnitudes M5, M6.5, and M8) demonstrated the applicability of the proposed method at different hazard levels. It should be noted, however, that the proposed method is more suitable for high seismic intensity. On the one hand, the ground motion uncertainty is dominant when the seismic intensity is large (Kwon and Elnashai 2006). On the other hand, if an earthquake is so weak to cause only few buildings to collapse, the remote sensing images may not provide sufficient information to achieve the optimal solutions effectively.

Validation using 2014 Ludian earthquake

The case study presented above confirms that the proposed similarity evaluation methods are able to offer a relatively good loss estimation. Nevertheless, the “target scenarios” are merely virtual cases based on the ancient 1730 Western Beijing earthquake.

In order to further validate the rationality of the proposed methods, the seismic loss estimation was performed using the August 31, 2014 Ludian earthquake data recorded in Yunnan Province of China. The magnitude of the earthquake was M6.5, the focal depth was 12 km, and the epicenter was located at 27.189 ° N, 103.409 ° E. The earthquake caused severe damage to the Longtoushan town 9 km away from the epicenter (Xu et al. 2015, Hu et al. 2016). The next day after the earthquake, China Earthquake Administration utilized UAVs and obtained aerial images of the disaster area. Using these images, the building collapse scene at Longtoushan town was timely identified (Figure 11a). According to the refined damage states of the buildings obtained through site investigations (Lin et al. 2015), the actual seismic loss Vactual can be calculated using Eqs. (1) and (2). Nevertheless, the Vactual was only obtained after nearly a month since the earthquake occurred.

Figure 11. The (a) identified, and (b) simulated building collapse distribution at Longtoushan town in Ludian earthquake.

Similar to the Section “Generation of different load cases” of the case study of Tsinghua Campus, five linear attenuation functions were defined by Eq. (13), where the domain of PGAmax is {0.2 g, 0.4 g, ... 1.2 g}. Hence a total of 30 different GMPEs were defined. The 28 near-field ground motions proposed by FEMA (2009) were selected as input. As a result, a total of 840 different THA load cases were generated leading to 840 simulation results. Using the two similarity measures proposed above, the scores of each simulation results were calculated, and the optimal simulation results were identified. The score-loss relationship is presented in Figure 12.

In addition, the National Strong Motion Observation Network System of China captured more than 70 ground motion records of the main shock (Xu et al. 2015, Hu et al. 2016), one of which was recorded by the strong motion station located rightly at Longtoushan town. This ground motion record, together with a regressed attenuation relationship (Xiong et al. 2017) was also used for comparison. The THA using this input was performed, the similarity score of the simulation result was calculated, and the corresponding loss was calculated and denoted as Vrecorded. The score-loss pair of this load case is presented as a star in Figures 12a and 12b. Note that the recorded ground motion only represents the earthquake tremor on a certain point. The inputted ground motion for different buildings may have some differences from it. Hence, the predicted collapse scene using the recorded ground motion, although is also very close to the real collapse scene, is not 100-percentage identical.

(1) Both the simple counting method and the weighted counting method led to the same optimal simulation result. The score of the optimal simulation result was less than 1, indicating that the simulated collapse distribution was not completely identical with the actual collapse distribution. However, comparing the simulated collapse (Figure 11b) with the actual collapse (Figure 11a), they were fairly similar.

(2) The loss estimation of the optimal simulation result was close to the actual loss, and far better than the estimation using the damage probability matrix (Figure 12c). The underlying key reason is that the proposed method takes advantage of an important information, i.e. the identified situation of building collapse.

(3) The estimated loss using the recorded Ludian ground motion, Vrecorded, agrees well with the actual loss, Vactual.

The seismic loss estimation was performed on a multi-core desktop computer (CPU: Intel E5-2695 v4@2.10Hz, 36 cores; RAM: 64GB). It should be noted that it took only 4 minutes to perform the above 840 nonlinear THAs in parallel. The similarity measures were computed within seconds. The computational efficiency can be further improved if using GPU parallel computing (Lu et al. 2014) or distributed computing (Xu et al. 2016), so that computation can be completed within several minutes even for a much larger region or much more THA load cases. With advances in remote sensing technologies, the satellite or aerial images of disaster areas are expected to be available within 24 hours, making a rapid attainment of the identified collapse situation of the buildings. Therefore, the methods proposed in this work represent a near-real-time seismic loss estimation method. The loss estimation can be provided within one or two days after an earthquake, with satisfactory accuracy compared to the site investigated loss, which may take weeks to obtain.

Figure 12. The score-loss relationship of the simulation results (2014 Ludian earthquake). (a) Simple counting method (Method A). (b) Weighted counting method (Method B). (c) Comparison of simulated loss and actual loss.

In this work, the optimal simulation results are identified merely based on matching collapse scene. This involves an assumption that if the collapse distribution of a simulation result is similar to the identified collapse distribution from the remote sensing images, then the simulated building damage states and the estimated loss are also regarded to be similar. In other words, the regional building seismic loss is highly correlated to the building collapse distribution. Due to the complexity of the nonlinear behaviors of the structures subjected to earthquake excitation, currently the analytical prove to this assumption was not given in this study. Nevertheless, the case studies (3 virtual earthquakes on Tsinghua Campus and the Ludian earthquake) could be treated as numerical experiments. The results of these case studies (Figures 9, 10, and 12) confirm that this assumption is relatively reasonable.

This work uses building-level damage, assessed by damage criteria, to calculate the seismic loss. As a matter of fact, nonlinear THA can provide detailed structural responses, such as displacement and acceleration time histories and peak values at each story of each building. Using these detailed responses, the damage states and repair costs of structural, drift-sensitive nonstructural, and acceleration-sensitive nonstructural components can be estimated based on FEMA P-58 method (FEMA 2012b), so as to obtain more refined building seismic damage and loss estimation. This also represents a proven advantage of the THA-based method against the damage probability matrix or the capacity spectrum method. Study on the combination of the THA-based and FEMA P-58 methods for regional loss estimation can be found elsewhere in Zeng et al. (2016). It should be noted, however, that such a combination method was not adopted as the implementation of Component (5) (see Figure 1) in order not to distract the focus of the proposed framework presented in this study.

Conclusions

In this work, a framework for near-real-time regional building seismic loss estimation is proposed. By taking advantages of the building collapse scene of the disaster area, which can be rapidly identified through remote sensing image analysis, the accuracy of the THA-based loss estimations is improved. The fact that the seismic loss estimation can be done within one or two days after an earthquake confirms a near-real-time efficiency. Two methods for selecting the optimal simulation results are proposed, i.e., simple counting method, and weighted counting method. Through the validation using the simulated case of the 1730 Western Beijing earthquake and the actual 2014 Ludian earthquake in China, the advantages of the proposed methods are demonstrated. The results indicate that:

(1) The two proposed similarity measure methods of collapse distribution can reasonably evaluate the similarity between simulated results and the identified building collapse situation. The simulated seismic loss tends to converge towards the actual loss when the similarity increases.

(2) Even when lacking rational ground motion input, the loss estimation of the optimal simulation results can be very close to the actual loss. The key reason behind is that the proposed method takes advantage of an important information, i.e. the identified situation of building collapse.

(3) The THAs can be completed within several minutes, while the similarity measure takes merely seconds. Using the satellite or aerial images of disaster areas which are expected to be available within 24 hours, the proposed method can adapt to the needs of rapid post-earthquake loss assessment.

Acknowledgements

The authors are grateful for Dr. Frank McKenna in University of California at Berkeley for giving constructive suggestions on this study. The authors are also grateful for the financial support received from the National Natural Science Foundation of China (No. 51578320), the China Scholarship Council, and the Beijing Natural Science Foundation (No. 8173057).

References

Abrahamson, N.A., Silva, W.J. and Kamai, R., 2014. Summary of the ASK14 Ground Motion Relation for Active Crustal Regions. Earthquake Spectra 30(3), 1025-1055.

Ancheta, T.D., Darragh, R.B., Stewart, J.P., Seyhan, E., Silva, W.J., Chiou, B.S., Wooddell, K.E., Graves, R.W., Kottke, A.R. and Boore, D.M., 2014. NGA-West2 Database. Earthquake Spectra 30(3), 989-1005.

Applied Technology Council (ATC), 1985. Earthquake Damage Evaluation Data for California, ATC-13, Redwood City, CA.

Bal, İ.E., Crowley, H., Pinho, R. and Gülay, F.G., 2008. Detailed Assessment of Structural Characteristics of Turkish RC Building Stock for Loss Assessment Models. Soil Dynamics and Earthquake Engineering 28(10-11), 914-932.

Bard, P.Y., Chazelas, J.L., Guéguen, P., Kham, M. and Semblat, J.F., 2008. Site-City Interaction, in Assessing and Managing Earthquake Risk. Springer, Netherlands, 91–114.

Bishop, C.M., 2006. Pattern Recognition and Machine Learning. Springer, Singapore.

Boore, D.M., Stewart, J.P., Seyhan, E. and Atkinson, G.M., 2014. NGA-West2 Equations for Predicting PGA, PGV, and 5% Damped PSA for Shallow Crustal Earthquakes. Earthquake Spectra 30(3), 1057-1085.

Booth, E., Saiko, K., Spence, R., Madabhushi, G., and Eguchi, R.T., 2011. Validating Assessments of Seismic Damage Made from Remote Sensing. Earthquake Spectra 27(S1), S157-S177.

Campbell, K.W. and Bozorgnia, Y., 2014. NGA-West2 Ground Motion Model for the Average Horizontal Components of PGA, PGV, and 5% Damped Linear Acceleration Response Spectra. Earthquake Spectra 30(3), 1087-1115.

Chaulagain, H., Rodrigues, H., Silva, V., Spacone, E. and Varum, H., 2016. Earthquake Loss Estimation for the Kathmandu Valley. Bulletin of Earthquake Engineering 14(1), 59-88.

Chiou, B.S.J. and Youngs, R.R., 2014. Update of the Chiou and Youngs NGA Model for the Average Horizontal Component of Peak Ground Motion and Response Spectra. Earthquake Spectra 30(3), 1117-1153.

Choi, S.S., Cha, S.H. and Tappert, C.C., 2010. A Survey of Binary Similarity and Distance Measures. Journal of Systemics, Cybernetics and Informatics 8(1), 43–48.

Dong, L. and Shan, J., 2013. A Comprehensive Review of Earthquake-Induced Building Damage Detection with Remote Sensing Techniques. ISPRS Journal of Photogrammetry and Remote Sensing 84, 85-99.

Ehrlich, D., Guo, H.D., Molch, K., Ma, J.W. and Pesaresi, M., 2009. Identifying Damage Caused by the 2008 Wenchuan Earthquake from VHR Remote Sensing Data. International Journal of Digital Earth 2(4), 309-326.

Erdik, M., Şeşetyan, K., Demircioğlu, M.B., Hancılar, U. and Zülfikar, C., 2011. Rapid Earthquake Loss Assessment after Damaging Earthquakes. Soil Dynamics and Earthquake Engineering 31(2), 247-266.

Federal Emergency Management Agency (FEMA), 2009. Quantification of Building Seismic Performance Factors, FEMA P-695. Washington, D.C.

Federal Emergency Management Agency (FEMA), 2012a. Multi-Hazard Loss Estimation Methodology HAZUS-MH 2.1 Advanced Engineering Building Module (AEBM) Technical and User’s Manual. Washington, D.C.

Federal Emergency Management Agency (FEMA), 2012b. Seismic Performance Assessment of Buildings Volume 1 - Methodology. Washington, D.C.

Foulser-Piggott, R., Spence, R., Eguchi, R.T. and King, A., 2016. Using Remote Sensing for Building Damage Assessment: GEOCAN Study and Validation for 2011 Christchurch Earthquake. Earthquake Spectra 32(1), 611-631.

GB, 2015. Seismic Ground Motion Parameters Zonation Map of China, GB 18306-2015. China Architecture and Building Press, Beijing, China. (in Chinese)

GB/T, 2008. The Chinese Seismic Intensity Scale, GB/T 17742-2008. Standardization Administration of China, Beijing, China. (in Chinese)

GB/T, 2011. Post-Earthquake Field Works - Part 4: Assessment of Direct Loss, GB/T 10208.4-2011. Standardization Administration of China, Beijing, China. (in Chinese)

Guo, G., Zhang, J. and Yorke-Smith, N., 2013. A Novel Bayesian Similarity Measure for Recommender Systems, in Proceedings, the Twenty-Third International Joint Conference on Artificial Intelligence, 3-9 August, 2013, Beijing, China.

Gusella, L., Adams, B.J., Bitelli, G., Huyck, C.K. and Mognol, A., 2005. Object-Oriented Image Understanding and Post-Earthquake Damage Assessment for the 2003 Bam, Iran, Earthquake. Earthquake Spectra 21(S1), 225-238.

Hori, M., 2011. Introduction to Computational Earthquake Engineering. Imperial College Press, London.

Hu, J.J., Zhang, Q., Jiang, Z.J., Xie, L.L. and Zhou, B.F., 2016. Characteristics of Strong Ground Motions in the 2014 Ms 6.5 Ludian Earthquake, Yunnan, China. Journal of Seismology 20(1), 361-373.

Hua, J., Hou, G. and Liu, X., 2005. Study of the Active Faults Generating the Earthquake of M 6.5 in the West of Beijing in 1730. Acta Scicentiarum Naturalum Universitis Pekinesis 41(4), 530-535. (in Chinese)

Huan, W.L., Shi, Z.L. and Yang, Y.L., 1996. The Yuanming Park Earthquake in Beijing in 1730. Journal of Seismological Research 19(3), 260-266. (in Chinese)

Huyck, C.K., 2016. Inferring Peak Ground Acceleration (PGA) From Observed Building Damage and EO-Derived Exposure Development to Develop Rapid Loss Estimates Following the April 2015 Nepal Earthquake. American Geophysical Union, Fall General Assembly 2016, abstract #IN33B-1821.

Isbiliroglu Y., Taborda R. and Bielak J., 2015. Coupled Soil-Structure Interaction Effects of Building Clusters During Earthquakes. Earthquake Spectra 31(1), 463-500.

Jaiswal, K. and Wald, D.J., 2011. Rapid estimation of the economic consequences of global earthquakes, Report No. 2011–1116. U.S. Geological Survey, Reston, Virginia.

Kale, Ö. and Akkar, S., 2017. A Ground-Motion Logic-Tree Scheme for Regional Seismic Hazard Studies. Earthquake Spectra 33(3), 837–856.

Kalkan, E. and Chopra, A.K., 2010. Practical Guidelines to Select and Scale Earthquake Records for Nonlinear Response History Analysis of Structures: US Geological Survey Open-File Report 2010-1068, Reston, Virginia.

Kwon, O. and Elnashai, A., 2006. The Effect of Material and Ground Motion Uncertainty on the Seismic Vulnerability Curves of RC Structure. Engineering Structures 28(2), 289-303.

Lang, D.H., Singh, Y. and Prasad, J.S.R., 2012. Comparing Empirical and Analytical Estimates of Earthquake Loss Assessment Studies for the City of Dehradun, India. Earthquake Spectra 28(2), 595–619.

Li, M., Zang, S.Y., Zhang, B., Li, S.S. and Wu, C.S., 2014. A Review of Remote Sensing Image Classification Techniques: The Role of Spatio-Contextual Information. European Journal of Remote Sensing 47(2014), 389-411.

Lin, X.C., Zhang, H.Y., Chen, H.F., Chen, H. and Lin, J.Q., 2015. Field Investigation On Severely Damaged Aseismic Buildings in 2014 Ludian Earthquake. Earthquake Engineering and Engineering Vibration 14(1), 169-176.

Lu, X.Z. and Guan, H., 2017. Earthquake Disaster Simulation of Civil Infrastructures: From Tall Buildings to Urban Areas. Springer, Singapore.

Lu, X.Z., Han, B., Hori, M., Xiong, C. and Xu, Z., 2014. A Coarse-Grained Parallel Approach for Seismic Damage Simulations of Urban Areas Based on Refined Models and GPU/CPU Cooperative Computing. Advances in Engineering Software 70, 90-103.

Lu, X.Z., Tian, Y., Guan, H. and Xiong, C., 2017. Parametric Sensitivity Study on Regional Seismic Damage Prediction of Reinforced Masonry Buildings based on Time-History Analysis. Bulletin of Earthquake Engineering 15(11), 4791-4820.

Mahmoud, S.M., Lotfi, A. and Langensiepen, C., 2011. Abnormal Behaviours Identification for an Elder’s Life Activities Using Dissimilarity Measurements, in Proceedings, the 4th International Conference on Pervasive Technologies Related to Assistive Environments, 25-27 May, 2011, Crete, Greece.

Martins, L., Silva, V., Marques, M., Crowley, H. and Delgado, R., 2016. Development and Assessment of Damage-to-Loss Models for Moment-Frame Reinforced Concrete Buildings: Damage-to-Loss Models for Moment-Frame R.C. Buildings. Earthquake Engineering & Structural Dynamics 45(5), 797-817.

Masi, A., Santarsiero, G., Digrisolo, A., Chiauzzi, L. and Manfredi, V., 2016. Procedures and Experiences in the Post-Earthquake Usability Evaluation of Ordinary Buildings. Bollettino Di Geofisica Teorica Ed Applicata 57(2), 199-220.

Qi, W., Su, G., Sun, L., Yang, F. and Wu, Y., 2017. Internet+ Approach to Mapping Exposure and Seismic Vulnerability of Buildings in a Context of Rapid Socioeconomic Growth: A Case Study in Tangshan, China. Natural Hazards 86(1), 107-139.

Rathje, E.M. and Adams, B.J., 2008. The Role of Remote Sensing in Earthquake Science and Engineering: Opportunities and Challenges. Earthquake Spectra 24(2), 471-492.

Samadzadegan, F. and Rastiveisi, H., 2008. Automatic Detection and Classification of Damaged Buildings, Using High Resolution Satellite Imagery and Vector Data. The International Archives of the Photogrammetry, Remote Sensing and Spatial Information Sciences 37, 415–420.

Semblat, J.F., Kham, M. and Bard, P.Y., 2008. Seismic-Wave Propagation in Alluvial Basins and Influence of Site-City Interaction. Bulletin of the Seismological Society of America, 98(6), 2665–2678.

Smerzini C., Pitilakis K. and Hashemi K., 2017. Evaluation of Earthquake Ground Motion and Site Effects in the Thessaloniki Urban Area by 3D Finite-Fault Numerical Simulations. Bulletin of Earthquake Engineering 15(3), 787-812.

Turkur, M. and Cetinkaya, B., 2005. Automatic Detection of EarthquakeDamaged Buildings Using DEMs Created from Pre and PostEarthquake Stereo Aerial Photographs. International Journal of Remote Sensing 26(4), 823–832.

Vu, T.T. and Ban, Y., 2010. Context-Based Mapping of Damaged Buildings from High-Resolution Optical Satellite Images. International Journal of Remote Sensing 31(13), 3411-3425.

Wald, D.J., Quitoriano, V., Heaton, T.H. and Kanamori, H., 1999. Relationships Between Peak Ground Acceleration, Peak Ground Velocity, and Modified Mercalli Intensity in California. Earthquake spectra 15(3), 557–564.

Xie, S., Duan, J., Liu, S., Dai, Q., Liu, W., Ma, Y., Guo, R. and Ma, C., 2016. Crowdsourcing Rapid Assessment of Collapsed Buildings Early after the Earthquake Based on Aerial Remote Sensing Image: A Case Study of Yushu Earthquake. Remote Sensing 8(9), 759.

Xiong, C., Lu, X.Z., Guan, H. and Xu, Z., 2016. A Nonlinear Computational Model for Regional Seismic Simulation of Tall Buildings. Bulletin of Earthquake Engineering 14(4), 1047-1069.

Xiong, C., Lu, X.Z., Lin, X.C., Xu, Z. and Ye, L.P., 2017. Parameter Determination and Damage Assessment for THA-Based Regional Seismic Damage Prediction of Multi-Story Buildings. Journal of Earthquake Engineering, 21(3), 461-485.

Xu, P., Wen, R., Wang, H., Ji, K. and Ren, Y., 2015. Characteristics of Strong Motions and Damage Implications of MS6. 5 Ludian Earthquake on August 3, 2014. Earthquake Science 28(1), 17-24.

Xu, Z., Lu, X.Z. and Law, K.H., 2016. A Computational Framework for Regional Seismic Simulation of Buildings with Multiple Fidelity Models. Advances in Engineering Software 99, 100-110.

Yamazaki, F., Yano, Y. and Matsuoka, M., 2005. Visual Damage Interpretation of Buildings in Bam City Using Quickbird Images Following the 2003 Bam, Iran, Earthquake. Earthquake Spectra 21(S1), 329-336.

Yeh, C., Loh, C. and Tsai, K., 2006. Overview of Taiwan Earthquake Loss Estimation System. Natural Hazards 37(1-2), 23-37.

Yin, Z.Q., 1996. Classification of Structure Vulnerability and Evaluating Earthquake Damage from Future Earthquake [J]. Earthquake Research in China 10(3), 261-268.

Yuan, Y., 2008. Loss Assessment of Wenchuan Earthquake. Journal of Earthquake Engineering and Engineering Vibration 28(5), 10-19.

Zeng, X., Lu, X.Z., Yang, T.Y. and Xu, Z., 2016. Application of the FEMA-P58 Methodology for Regional Earthquake Loss Prediction. Natural Hazards 83(1), 177-192.

Introduction
Research
Application
Teaching
Publications
Download
Issues
Others


Our Lab

Collapse Prevention Committee