|
5. Conclusions
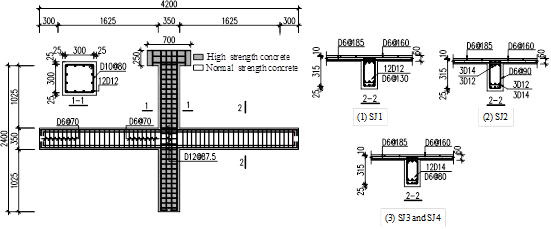
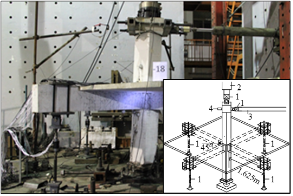
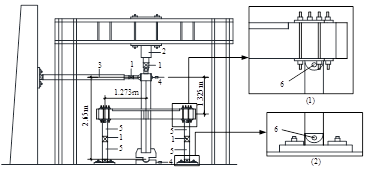
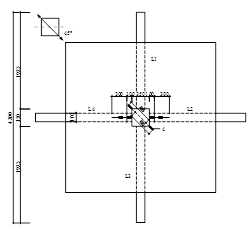
Four spatial sandwich beam-column joints with different concrete strength ratios were tested under skew cyclic loads.
Based on the experimental and analytical results, the following conclusions
can be made.
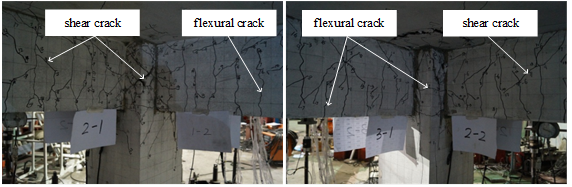
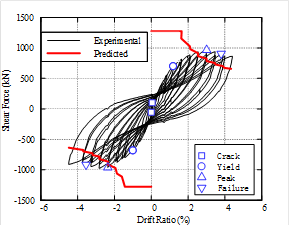
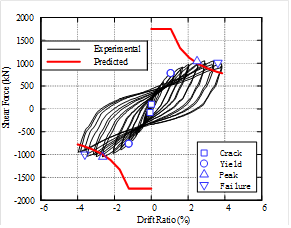
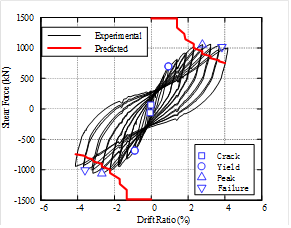
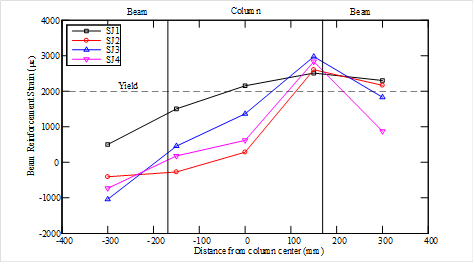
(1) The failure modes of all the sandwich joints are in form of joint shear failure, subsequent to the flexural yielding of the beams, while the ductility coefficient is greater than 3.0 which satisfies the ductility demands.
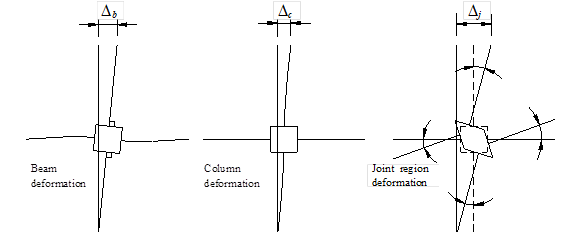
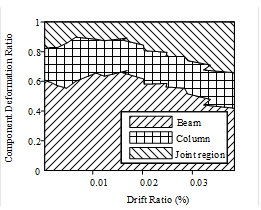
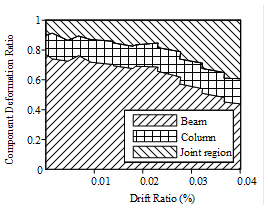
(2) Compared to the joints with lower concrete
strength ratios a, the specimen with the larger ratio features larger deformation at the joint.
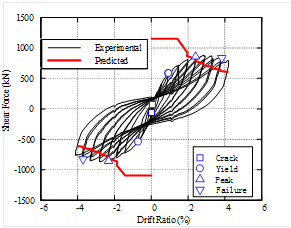
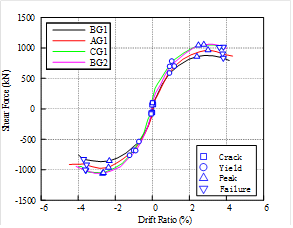
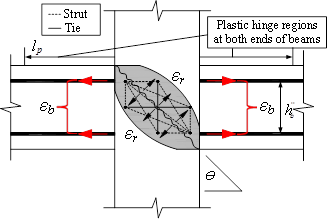
(3) Based on the softened strut-and-tie model, a shear strength model of spatial
sandwich joints, taking into account the effects of concrete strength ratio, the floor slabs and the
plastic region of beams, is proposed herein. The predicted shear strengths are
compared with the test results in this work and those in the literature. The comparison indicates that the proposed equations can accurately predict the shear strengths of the sandwich beam-column joints with higher accuracy than other available models. Notwithstanding, further
study is necessary to more general situations where the maximum load applied
at a different angle or different loading histories in the two orthogonal
directions.
Acknowledgement
This work was financially supported by the
National Natural Science Foundation of China (No. 51778341) and the National
Key R&D Program (No. 2017YFC0702902).
Compliance with Ethical Standards
Funding: This study was funded by the National Natural Science Foundation of China (grant
number 51778341) and the National Key R&D Program (grant number 2017YFC0702902).
Conflict of Interest: The authors declare that they have no conflict of interest.
References
1.
Lu
X, Lu XZ, Guan H, Xie LL (2016) Application of earthquake-induced collapse
analysis in design optimization of a super-tall building. The Structural Design
of Tall and Special Buildings, 25(17): 926-946.
2.
Bianchini
AC, Woods RE, Kesler CE (1960) Effect of floor concrete strength on column
strength. ACI Journal, 31(11): 1149-1169.
3.
ACI
Committee 318-14 (2014) Building code requirements for structural concrete
(ACI 318-14) and commentary. American Concrete Institute, Farming Hills, MI.
4.
Ospina
CE, Alexander SDB (1998) Transmission of interior concrete column loads through
floors. Journal of Structural Engineering, 124 (6): 602-610.
5.
Lee
JH, Yoon YS (2012) Prediction of effective compressive strength of corner
columns composing weaker slab-column joint. Magazine of Concrete Research,
64(12): 1113-1121.
6.
Shin
HO, Yoon YS, Cook WD, Mitchell D (2016) Enhancing the performance of UHSC
columns intersected by weaker slabs. Engineering Structures, 127: 359-373.
7.
Shin
HO, Yoon YS, Mitchell D (2017) Axial load transfer in non-slender ultra-high-strength
concrete columns through normal-strength concrete floor slabs. Engineering
Structures, 136: 466-480.
8.
Yu
Q, Li SM (2004) Research on frame¡¯s joint that concrete strength of core is
inferior to that of column. Journal of Tongji University (Natural Science),
32(12): 1583-1588. (in Chinese)
9.
Zhao
M, Su XZ, Lu DY, Wang D (2005) Seismic properties of RC frame sandwich type
joints. Proceedings of 13th World Conference on Earthquake Engineering, Canada.
10.
Xu B, Cheng MK, Zhang
ML, Qian JR (2006) Experimental study on behavior of reinforced concrete beam-column
joint with lower core concrete. Industrial Construction, 36(6): 18-22. (in
Chinese)
11.
Yang ZH (2007) Seismic
behavior and design method of RC sandwich beam-column joints. Ph.D. Dissertation,
Chongqing University. (in Chinese)
12.
Li YM, Liu JW (2010)
Pseudo-static test for reinforced concrete sandwich beam-column joints, Journal
of Building Structures, 31(12): 74-82. (in Chinese)
13.
Yan WM, Hou LQ, Zhang
JB, Chen SC (2017) Seismic performance of space interior joints with different
concrete strength and shear capacity calculation. Journal of Building Structures,
38(2): 117-125. (in Chinese)
14.
Yang ZH, Li YM, Liu
JW (2010) Seismic load tests on reinforced concrete beam-column sandwich joints
with strengthening measures. Fourth International Conference on Experimental
Mechanics, Proc. of SPIE Vol. 7522 752264-1.
15.
Ministry of Housing
and Urban-Rural Development of the People's Republic of China (2010) Code
for design of concrete structures (GB 50010-2010). China Architecture &
Building Press, Beijing.
16.
Xie LL, Lu XZ, Guan
H, Lu X (2015) Experimental study and numerical model calibration for earthquake-induced
collapse of RC frames with emphasis on key columns, joints and overall structure.
Journal of Earthquake Engineering, 19(8): 1320-1344.
17.
Gamble LW, Klinar DJ
(1991) Test of high strength concrete columns with intervening floor slabs.
Journal of Structural Engineering, 117(5): 705-716.
18.
Kimreth M, Li B, Imran
I (2012) Seismic performance of lightly reinforced concrete exterior beam-column
joints. Advances in Structural Engineering, 15 (10): 1765-1780.
19.
Liu, A (2001) Seismic assessment and retrofit
of pre-1970s reinforced concrete frame structures. Ph.D. Dissertation, University
of Canterbury Civil Engineering.
20. Ministry of Housing
and Urban-Rural Development of the People's Republic of China (2010) Code
for seismic design of buildings (GB 50011-2011). China Architecture &
Building Press, Beijing.
21. ASCE. (2016). Minimum
design loads for buildings and other structures (ASCE/SEI 7-16). American
Society of Civil Engineers, Reston, Virginia.
22. Steelman JS, Hajjar
JF (2009) Influence of inelastic seismic response modeling on regional loss
estimation. Engineering Structures, 31(12): 2976-2987.
23. Park S, Mosalam KM.
(2013) Experimental investigation of nonductile RC corner beam-column joints
with floor slabs. Journal of Structural Engineering, 139(1):1-14.
24. Risi MTD, Verderame
GM (2017) Experimental assessment and numerical modelling of exterior non-conforming
beam-column joints with plain bars. Engineering Structures, 150: 115-134.
25. Ministry of Housing
and Urban-Rural Development of the People's Republic of China (2015) Specification
for seismic test of buildings (JGJ/T 101-2015). China Architecture & Building
Press, Beijing. (in Chinese).
26. Liao FY, Han LH, Tao
Z. (2014) Behaviour of composite joints with concrete encased CFST columns
under cyclic loading: Experiments. Engineering Structures, 59(2), 745-764.
27. ASCE (2013) Seismic
Evaluation and Retrofit of Existing Buildings (ASCE/SEI 41-13). American Seismic
Evaluation and Retrofit of Existing Buildings, Reston, Virginia.
28.
Shafaei J, Hosseini
A, Marefat MS, Ingham JM, Zare H. (2017) Experimental evaluation of seismically
and non-seismically detailed external RC beam-column joints. Journal of Earthquake
Engineering, 21(5): 776-807.
29.
Kassem W (2016) Strut-and-tie
modelling for the analysis and design of RC beam-column joints. Materials
and Structures, 49(8): 3459-3476.
30.
Li B, Lam SS, Wu B,
Wang YY (2015) Effect of high axial load on seismic behavior of reinforced
concrete beam-column joints with and without strengthening. ACI Structural
Journal, 112(6): 713-723.
31.
Hwang SJ, Tsai RJ, Lam
WK, Moehle JP (2017) Simplification of softened strut-and-tie model for strength
prediction of discontinuity regions. ACI Structural Journal, 114(5): 1239-1248.
32.
Okahashi Y, Pantelides
CP (2017) Strut-and-tie model for interior RC beam-column joints with substandard
details retrofitted with CFRP jackets. Composite Structures, 165: 1-8.
33.
Hwang SJ, Lee HJ (2002)
Strength prediction for discontinuity regions by softened strut-and-tie model.
Journal of Structural Engineering, 128(12): 1519-1526.
34.
Vecchio FJ, Collins
MP (1993) Compression response of cracked reinforced concrete. Journal of
Structural Engineering, 119(12), 3590-3610.
35.
Hwang SJ, Lee HJ (1999)
Analytical model for predicting shear strengths of exterior reinforced concrete
beam-column joints for seismic resistance. ACI Structural Journal, 96(5),
846-857.
36.
Hwang SJ, Lee HJ (2000)
Analytical model for predicting shear strengths of interior reinforced concrete
beam-column joints for seismic resistance. ACI Structural Journal, 97(1),
35-44.
37.
Xing GH, Liu BQ, Niu
DT (2013) Shear strength of reinforced concrete frame joints using modified
softened strut-and-tie model. Engineering Mechanics, 30(8): 60-66. (in Chinese)
38. Xing GH, He ZB, Niu
DT, Wu T, Liu X (2014). Analytical model for shear strength of reinforced
concrete beam-column-slab exterior joints. Journal of Central South University
(Science and Technology), 45(9): 3277-3282. (in Chinese)
39. Joh O, Goto Y, Shibata
T (1988) Behavior of three-dimensional reinforced concrete beam-column subassemblages
with slabs. Bulletin of the Faculty of Engineering, Hokkaido University.
40.
Lee JY, Kim JY, Oh GJ
(2002) Strength deterioration of reinforced concrete beam-column joints subjected
to cyclic loading. Engineering Structures, 31(9): 2070-2085.
41.
Joint ACI-ASCE Committee
352 (2002) Recommendations for design of beam-column joints in monolithic
reinforced concrete structures (ACI 352R-02). American Concrete Institute,
Farmington Hills, MI.
42.
CSA Committee A23.3
(2014) Design of concrete structures (CSA A23.3-14). Canadian Standard Association,
Toronto, Ontario.
Notations
|
Ac
|
gross-sectional area of the column;
|
|
As, 
|
sectional areas of the top and bottom reinforcement
of the beam, respectively;
|
|
Asb
|
reinforcement area in the tension zone of the beam;
|
|
Asp
|
reinforcement area of the floor slab located within the beam effective
flange width;
|
|

|
area of the diagonal strut
|
|
Asvj
|
total sectional area of transverse reinforcements
within the effective width of the joint core zone in the loading direction;
|
|

|
distance between the centroid of resultant forces of longitudinal compressive
steel reinforcements and the extreme compression face of the beam.
|
|
as, bs
|
depth and width of the diagonal strut, respectively;
|
|
bb, hb
|
beam width and depth, respectively;
|
|
bc, hc
|
column width and depth, respectively;
|
|
bj, hj
|
effective width and height
of the core zone of the joint, respectively;
|
|
cb, cc
|
depth of the compression zone
of the beam and column, respectively;
|
|


|
distances between the extreme longitudinal reinforcement in the beams
and columns, respectively;
|
|
hbo
|
effective depth of beam;
|
|

|
distance between the centroids of upper and lower beam reinforcement;
|
|
Hc
|
height of column;
|
|
lp
|
length of the plastic hinge region of the beam;.
|
|
s
|
spacing of the transverse reinforcements
along the beam axis;
|
|
ts
|
thickness of the floor slab;
|
|
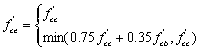
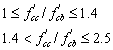
 ,
, 
|
compressive strengths of concrete of the
beam and the column, respectively;
|
|

|
cylinder strength of concrete;
|
|

|
effective compressive
strength;
|
|
ft
|
design tensile strength of concrete;
|
|
fyv
|
design strength of shear reinforcement;
|
|
fyh, fyv
|
yield strength of the joint hoop reinforcement
and intermediate column bars, respectively;
|
|
fyb, fyp
|
yield strength of the beam reinforcement and slab reinforcement, respectively;
|
|
N
|
design axial force;
|
|
Nc
|
axial force acting on the column;
|
|
VACI
|
horizontal joint shear strength predicted
by ACI 318-14;
|
|
VCSA
|
horizontal joint shear strength predicted
by CSA A23.3-04;
|
|
Vjbf
|
horizontal joint shear strength when the
beam reinforcement yields;
|
|
Vj1
|
horizontal shear strength of type 1 joint;
|
|
Vjd
|
horizontal joint shear strength predicted
by Chinese Design Code for Concrete Structures;
|
|
Vsst
|
horizontal joint shear strength of the softened
strut-and-tie model;
|
|

|
horizontal joint shear strength of the modified
softened strut-and-tie model;
|
|
Vt
|
measured shear strength;
|
|
Eh
|
energy dissipated in each load cycle;
|
|
Ee
|
energy dissipation of an equivalent elastic cycle;
|
|
K
|
strut-and-tie index;
|
|
M /(V
h)
|
shear span ratio;
|
|
a
|
concrete strength
ratio;
|
|
q
|
angle between the diagonal strut and horizontal
axis;
|
|
gRE
|
seismic adjusting factor;
|
|
gh, gv
|
fractions of diagonal compression transferred
by the horizontal ties in the absence of the vertical ties and
the vertical ties in the absence of the horizontal ties, respectively;
|
|
 ,
, 
|
balanced forces of the horizontal ties and
vertical ties, respectively;
|
|
 ,
, 
|
indexes of the horizontal and vertical ties,
respectively;
|
|
D
|
lateral deformation at the top of the column;
|
|
eb
|
longitudinal strain of the beam reinforcement in the plastic hinge region
of the joint;
|
|
ebf
|
tensile strain of the beam at yielding;
|
|
er, ed
|
average principal tensile and compressive
strains in the joint, respectively;
|
|
ej
|
average concrete strain in the center of
the joint;
|
|
xh
|
equivalent hysteretic damping ratio;
|
|
hj
|
confinement effect factor of the orthogonal
beams;
|
|
n
|
softening coefficient of the
concrete;
|
|
f
|
strength reduction ratio;
|
|
fm
|
rotation angle of the column;
|
|
fpmp, fpmn
|
positive and negative plastic rotational angles,
respectively.
|
|


 (14)
(14)