Seismic loss assessment for buildings with various-LOD BIM data

Zhen Xu a, Xinzheng Lu b,*, Xiang Zeng b, Yongjia Xu b, Yi Li c

a Beijing Key Laboratory of Urban Underground Space Engineering, School of Civil and Resource Engineering, University of Science and Technology Beijing, Beijing 100083, China;

b Key Laboratory of Civil Engineering Safety and Durability of China Education Ministry, Department of Civil Engineering, Tsinghua University, Beijing 100084, China;

c Key Laboratory of Urban Security and Disaster Engineering of Ministry of Education, Beijing University of Technology, Beijing 100124, China.

Advanced Engineering Informatics,
2019, 39: 112-126. DOI: 10.1016/j.aei.2018.12.003

Abstract: Earthquake-induced loss of buildings is a fundamental concern for earthquake-resilient cities. The FEMA P-58 method is a state-of-the-art seismic loss assessment method for buildings. Nevertheless, because the FEMA P-58 method is a refined component-level loss assessment method, it requires highly detailed data as the input. Consequently, the knowledge of building details will affect the seismic loss assessment. In this study, a seismic loss assessment method for buildings combining building information modeling (BIM) with the FEMA P-58 method is proposed. The detailed building data are automatically obtained from the building information model in which the building components may have different levels of development (LODs). The determination of component type and the development of the component vulnerability function when the information is incomplete are proposed. The modeling rules and the information extraction from BIM through the Autodesk Revit application programming interface (API) are also proposed. Finally, to demonstrate the rationality of the proposed method, an office building that is available online is selected, and the seismic loss assessments with various-LOD BIM data are performed as case studies. The results show that, on the one hand, even if the available building information is limited, the proposed method can still produce an acceptable loss assessment; on the other hand, given more information, the accuracy of the assessment can be improved and the uncertainty can be reduced using the proposed method. Consequently, this study provides a useful reference for the automation of the refined seismic loss assessment of buildings.

Key words: building seismic loss; building information modeling; FEMA P-58; level of development; vulnerability function

Introduction

Earthquake-induced loss of buildings is a fundamental concern for earthquake-resilient cities [1-2]. The Federal Emergency Management Agency (FEMA) of the United States proposed the FEMA P-58 method [3], which is a state-of-the-art seismic loss assessment method for buildings [4]. This method can directly calculate the seismic damage and loss of each type of component in the building, thereby making it easier to analyze the resilience of the building. This method has been used in many studies for the refined seismic performance assessment of buildings [5-9]. Nevertheless, because the FEMA P-58 is a component-level loss assessment method, it requires highly detailed input data. For example, FEMA P-58 provides 12 types of wall finishes (nine available for direct use). Given a certain wall finish, a series of data (e.g., surface material, wall height, connection details of the wall, etc.) are required to determine its corresponding type from the 12 candidates. Consequently, the knowledge of building details affects the seismic loss assessment. However, obtaining such knowledge is a critical challenge in the application of the FEMA P-58 method.

Building information modeling (BIM) can be a key technology in solving the problem above. BIM has been used in construction industry to facilitate the exchange and interoperability of information from design and construction, to maintenance [10-13]. The detailing of structural and non-structural components available in building information models is essential for building loss assessment to properly attribute the characteristics of damage and loss [14]. However, certain problems still need to be solved before applying BIM to the building loss assessment in FEMA P-58:

(1) In a building information model, building components with different levels of development (LODs) contain different amounts of effective information. Hence, it is necessary to establish a uniform framework that can accommodate different LODs. Moreover, a higher LOD should lead to a more refined seismic loss assessment result using such a framework.

(2) Even if a component in a building information model has a high LOD, it may not contain all the information required to determine its corresponding type from the component types provided in the FEMA P-58 database. In addition, the modeling styles vary with different modelers, thus increasing the difficulty and failure rate of the information extraction from different building information models. Consequently, it is necessary to develop appropriate rules for the modeling process, so that the established model can provide sufficient data required by the seismic loss assessment of buildings.

In this work, a seismic loss assessment method for buildings is proposed combining BIM with the FEMA P-58 method. Firstly, the FEMA P-58 method is briefly introduced, and the limitations of the FEMA P-58 method are discussed. Subsequently, the solution is proposed, which is able to determine the component type based on the classification trees of the components and develop a component vulnerability function when the information is incomplete. Modeling rules and information extraction for building information models using the Autodesk Revit application programming interface (API) are also suggested. Finally, to demonstrate the rationality of the proposed method, seismic loss assessments are calculated using various-LOD BIM data for an office building that is accessible online. This work provides a useful reference for the automation of building seismic loss assessment.

The FEMA P-58 method and its limitations

The FEMA P-58 method

The fundamental principle of the FEMA P-58 method is the next-generation performance-based earthquake engineering (PBEE) framework [15, 16]. In the FEMA P-58 method, seismic loss is calculated by the following steps:

(1) Select proper ground motions as input. Subsequently, calculate the structural responses (also known as the engineering demand parameters, EDPs), including the peak interstory drift ratios, peak floor accelerations, etc.

(2) For the cases where the building does not collapse and is repairable, calculate the repair cost of each component. For each component, first calculate its damage state according to its fragility functions (Fig. 1 a) and the EDP at the story where the component is located; subsequently, calculate its repair cost using the corresponding consequence functions (Fig. 1 b) of the component.

(3) Obtain the total seismic loss of the entire building by summing the repair costs of all components. The total seismic loss considers the uncertainties of the structural responses, component fragility functions, and consequence functions by utilizing the Monte Carlo simulations.

(a) Fragility functions, and (b) consequence functions (repair costs) of a typical gypsum wall board (GWB) partition component (C1011.001c)

(a) Fragility functions, and (b) consequence functions (repair costs) of a typical gypsum wall board (GWB) partition component (C1011.001c)

(a)

(b)

Fig. 1 (a) Fragility functions, and (b) consequence functions (repair costs) of a typical gypsum wall board (GWB) partition component (C1011.001c)

Limitations of the FEMA P-58 method

To render FEMA P-58 practical, FEMA proposed a database of fragility functions and consequence functions for 764 types of components (among which 322 components require certain user-defined parameters, and thus cannot be directly used) [3]. For example, five different gypsum wall board (GWB) partition components are listed in the FEMA P-58 database. Different components are classified according to the wall attributes, such as the type of stud material, wall height, type of installation method, etc. The classification tree of the GWB partition is shown in Fig. 2 , in which each fragility classification number in the leaf node represents a particular partition. The leaf node shown with a dashed line is a partition in which certain parameters are missing, and thus cannot be used unless the user inputs the missing parameters. The FEMA P-58 database discussed in this study refers to the version that was updated in September 2016 [17].

Classification tree of the GWB partition component

Fig. 2 Classification tree of the GWB partition component

Although FEMA has established such a rich component database after 10 years of effort [3], the following problems still exist:

(a) The component type cannot be determined when the information is incomplete. As shown in Fig. 2 , if some of the key information of a component is insufficient (e.g., the stud material of a gypsum wall partition is unknown), the fragility classification number of the component may not be uniquely determined. In these cases, the existing literature suggests determining the component type using specific rules. For example, Gobbo et al. [18] directly selected the component type with the best seismic performance. In other studies, the component classification number is directly assigned without a specific rule [4], which may lead to errors in the loss assessment results.

(b) The database still requires further improvement. Not only 42% of the components still require user-defined parameters and thus cannot be directly used, but also some structural and non-structural components are not yet included in the current component database. For instance, three of four types of the elevator (D1014) require user-defined parameters. As for the escalator (D1021), no data pertaining to it exists in the current database.

(c) The current database is only applicable to specific areas and periods. It was developed primarily for the applications in the United States [3]. Consequently, whether it can be directly applied to other countries and regions requires careful consideration. For example, a study [19] shows that the direct application of the FEMA P-58 database to the loss assessment of buildings in Italy will significantly underestimate the loss of infill walls and partition walls. In addition, the cost estimates in the database must be updated regularly, or they could become obsolete in a few years [20].

The FEMA P-58 method defines the open-sourced and formatted component fragility specifications (i.e., the ¡°detailed descriptions of potential component damage states, fragility functions, and consequence functions¡± [3]), and the component database is flexible and extensible. These good designs allow the database to be easily modified and extended. Consequently, problems (b) and (c) can be solved through the efforts of researchers worldwide by modifying the existing database or developing new component fragility specifications based on local conditions. After peer review, these components can be updated or added to the FEMA P-58 database. For example, researchers have developed fragility specifications of reinforced concrete (RC) structural components and masonry infill walls suitable for Italian buildings [21, 22]. The Global Earthquake Model (GEM) also proposed a series of technical reports to guide the worldwide development of component fragility specifications based on local conditions [23].

Owing to the reasons above, problems (b) and (c) are not discussed herein, while the solution to problem (a) is proposed in Section 3.

Vulnerability function of building components with various LODs

Framework

In terms of the abovementioned problem (a) of the FEMA P-58 method, a solution is proposed as follows:

(1) Determine the potential fragility classification numbers

If some key information of a component is insufficient, the classification process will stop at a branch node rather than at a leaf node of the classification tree. In this case, this study suggests the following steps to determine the type of component: (a) set all the available leaf nodes from the child nodes of the branch node as ¡°potential fragility classification numbers¡±; (b) randomly select the fragility classification number of the component from the potential fragility classification numbers. A GWB partition component is used as an example (Fig. 3). Assuming that the stud material of the GWB partition is ¡°metal¡± and the height is ¡°full height,¡± the classification process stops at node 3 of the classification tree owing to incomplete information. Consequently, the component could be C1011.001a, C1011.001c, or C1011.001d. Because C1011.001a requires user-defined parameters (i.e., problem (b) mentioned in Section 2.2), C1011.001c and C1011.001d are set as the potential fragility classification numbers. Subsequently, the component type is randomly selected from the two potential options with the probability of p1 and p2, respectively, where p1 + p2 = 1. This study assumes p1 = p2 = 0.5. However, when other prior knowledge is available (e.g., if it is known that modeling wall partition ¡°with returns¡± can simulate the fragility of the partition more accurately), the values of p1 and p2 can be adjusted accordingly.

Determination of the component type when information is incomplete

Fig. 3 Determination of the component type when information is incomplete

(2) Perform the Monte Carlo simulations

A large number of the Monte Carlo simulations are performed to obtain the component vulnerability function. The vulnerability function obtained through such a solution combines the features of all the potential component types (i.e., C1011.001c and C1011.001d in the case of Fig. 3). This solution is illustrated in Fig. 4. The EDP is obtained every Dedp in a range of interest [0, upper limit]. For a given EDP = edp, a Monte Carlo simulation is performed, and each simulation is denoted as a ¡°realization¡±. In each realization, the component type is first randomly selected from the potential fragility classification numbers; subsequently, based on the corresponding fragility curves and edp, the probabilities of the occurring different damage states are calculated, and the damage state is randomly determined accordingly (it may be assumed as dsi); finally, based on the consequence function corresponding to the damage state dsi, the unit repair cost l | edp is randomly determined. Through multiple realizations, multiple sample values of l | edp can be obtained. Here, the random variable l | edp does not obey the typical distributions (such as normal distribution), and the feature of the distribution varies with edp. For clarity, this study adopts the 10% quantile, median, and 90% quantile of l | edp to reflect the feature of the distribution. Our numerical tests show that when the number of realizations is larger than 500, the distribution of l | edp tends to be stable. Because the calculation time per realization is small (far less than 1 ms), the number of realizations is set as 1000 in this study.

Flowchart to obtain the component vulnerability function using the Monte Carlo simulations

Fig. 4 Flowchart to obtain the component vulnerability function using the Monte Carlo simulations

A building information model may contain components with different LODs. Consequently, the richness of available information is different for different components. A primary advantage of the proposed solution described above is that it accommodates different LODs using a uniform framework based on the FEMA P-58 method, and also exploits the available information. More information leads to less potential fragility classification numbers and less uncertainty of the vulnerability function. In the following sections, typical structural and non-structural components are selected as examples to illustrate the establishment of the vulnerability function of components with different LODs.

Vulnerability function of structural components

The steel moment frame connection (B1035) is selected as an example to demonstrate the proposed method for structural components. FEMA P-58 provides 12 types of steel moment frame connections; their classification tree is shown in Fig. 5. The attributes used for the classification includes the number of beams alongside the connection, beam height, connection type, and whether the beam end is a reduced beam section (RBS). Six nodes in the classification tree are selected for illustration, and they are numbered 1 to 6 in the order of their depths. The vulnerability function for each node is subsequently calculated assuming that the component quantity is 10, and the unit repair cost is used.

Classification tree of the steel moment frame connection provided in the FEMA P-58 database

Fig. 5 Classification tree of the steel moment frame connection provided in the FEMA P-58 database

The vulnerability functions of nodes 1 to 6 are shown in Fig. 6. The EDP of the steel moment frame connection is the interstory drift ratio. When the EDP is larger than 0.08, the unit repair cost tends to be stable. By comparing the vulnerability functions of different nodes, some interesting conclusions can be drawn as follows:

(a) Fig. 6a shows that even if no information is available for a steel moment frame connection, the repair cost can still be assessed. As a trade-off, the uncertainty of the estimated repair cost is relatively high.

(b) Comparing Figs. 6d, e, and f, it can be found that as more information is given, the nodes with higher depths can be reached, and the uncertainty of the estimated repair cost tends to decrease. Consequently, more information leads to better seismic loss assessment results.

(c) Some information (e.g., the number of beams alongside the connection) has a limited effect on both the median and the uncertainty of the repair cost (Figs. 6a and b). In contrast, some information (such as the connection type) can result in a significant reduction in the uncertainty (Figs 6d and e). Therefore, the vulnerability functions of different nodes in the classification tree shown in Fig. 6 can facilitate identification of the key attributes that significantly affect the uncertainty of the seismic loss assessment.

Vulnerability functions of nodes 1 to 6 from the classification tree of steel moment frame connection. P10 represents 10% quantile, and P90 represents 90% quantile

Vulnerability functions of nodes 1 to 6 from the classification tree of steel moment frame connection. P10 represents 10% quantile, and P90 represents 90% quantile

(a) Node 1

(b) Node 2

Vulnerability functions of nodes 1 to 6 from the classification tree of steel moment frame connection. P10 represents 10% quantile, and P90 represents 90% quantile

Vulnerability functions of nodes 1 to 6 from the classification tree of steel moment frame connection. P10 represents 10% quantile, and P90 represents 90% quantile

(c) Node 3

(d) Node 4

Vulnerability functions of nodes 1 to 6 from the classification tree of steel moment frame connection. P10 represents 10% quantile, and P90 represents 90% quantile

Vulnerability functions of nodes 1 to 6 from the classification tree of steel moment frame connection. P10 represents 10% quantile, and P90 represents 90% quantile

(e) Node 5

(f) Node 6

Fig. 6 Vulnerability functions of nodes 1 to 6 from the classification tree of steel moment frame connection. P10 represents 10% quantile, and P90 represents 90% quantile

The American Institute of Architects (AIA) developed an LOD specification, which was further expanded by the BIMForum [24]. According to the detailed descriptions of steel moment frame connections by the BIMForum, components with an LOD of 200 should accurately define the structure grids (layout); furthermore, components with an LOD of 350 or higher should have specific sizes and connection details. Therefore, a component with an LOD of 200 contains information such as its quantity and the number of beams alongside the connection; thus, the classification process can reach node 2 or node 3 (represented by the bold black line in Fig. 5). However, a component with an LOD of 350 or higher contains all the required information, and thus can reach the leaf node (represented by the bold red line in Fig. 5).

Vulnerability function of non-structural components

The GWB partition (C1011) is selected as an example for non-structural components. The classification tree is shown in Fig. 3. Six nodes in the classification tree are selected for illustration, and they are numbered 1 to 6 in the order of their depths. The vulnerability function for each node is subsequently calculated assuming that the component quantity is 10, and the unit repair cost is used. The result is shown in Fig. 7. When the EDP is larger than 0.04, the unit repair cost tends to be stable, except for the median value of nodes 1 and 3. Taking the repair cost of node 3 when interstory drift ratio = 0.06 (denoted as l3 | 0.06) as an example: the repair costs of the two potential fragility classification numbers of node 3, i.e., C1011.001c (Fig. 7d) and C1011.001d (Fig. 7e), differ significantly from each other. Consequently, the probability density function of l3 | 0.06 contains multiple peaks, and the density at the median is low (Fig. 8a), thus implying that the slope at the median value of the empirical distribution function of l3 | 0.06 is small. This leads to significant fluctuations.

When the interstory drift ratio is 0.06, both C1011.001c and C1011.001d reach their highest damage states with almost 100% probability. However, according to the FEMA P-58 database, for C1011.001c, three damage states exist; and for C1011.001d, only two damage states exist. Because the repair cost at damage state 3 is much larger than the repair cost at damage state 2 (Fig. 1b), the repair cost of C1011.001c is much larger than the repair cost of C1011.001d.

Vulnerability functions of nodes 1 to 6 from the classification tree of GWB partition

Vulnerability functions of nodes 1 to 6 from the classification tree of GWB partition

(a) Node 1

(b) Node 2

Vulnerability functions of nodes 1 to 6 from the classification tree of GWB partition

Vulnerability functions of nodes 1 to 6 from the classification tree of GWB partition

(c) Node 3

(d) Node 4

Vulnerability functions of nodes 1 to 6 from the classification tree of GWB partition

Vulnerability functions of nodes 1 to 6 from the classification tree of GWB partition

(e) Node 5

(f) Node 6

Fig. 7 Vulnerability functions of nodes 1 to 6 from the classification tree of GWB partition

Sample attributes of node 3 of the GWB partition when interstory drift ratio = 0.06 (setting number of realizations = 10,000 to obtain 10,000 samples)

Sample attributes of node 3 of the GWB partition when interstory drift ratio = 0.06 (setting number of realizations = 10,000 to obtain 10,000 samples)

(a) Probability density distribution histogram

(b) Empirical cumulative distribution function

Fig. 8 Sample attributes of node 3 of the GWB partition when interstory drift ratio = 0.06 (setting number of realizations = 10,000 to obtain 10,000 samples)

According to the detailed descriptions of the interior partition by the BIMForum, components with an LOD of 200 should accurately define the type of material, with flexible layouts, locations, heights, and elevation profiles. Components with an LOD of 300 should contain specific geometries and locations; components with an LOD of 350 or higher should contain members at any interface with wall edges. Therefore, for the component with an LOD of 200, the classification process reaches nodes with a depth of 2 (such as node 2 in Fig. 3). For the component with an LOD of 300, the classification process reaches nodes with a depth of 3 (such as node 3 in Fig. 3). Components with an LOD of 350 or higher contain all the required information, and thus the classification process can reach the leaf node (such as nodes 4 to 6 in Fig. 3).

The information provided by BIM can reduce the uncertainty caused by the component type as well as the component quantity. For example, for a LOD 200 partition, if its quantity is unknown, it can be estimated according to the normative quantities given in Appendix F of FEMA P-58 [3]. For example, a 900 m2 office building contains approximately 10 units of partition walls (1 unit = 1,300 square feet) with a dispersion of 0.2. After considering the uncertainty of the quantity, the consequence function of node 2 in Fig. 3 is calculated, as shown in Fig. 9. Comparing with Fig. 7b, it can be found that if the exact component quantity is available, the uncertainty of the repair cost can be significantly reduced.

Vulnerability functions of node 2 from the classification tree of GWB partition considering the uncertainty of component quantity

Fig. 9 Vulnerability functions of node 2 from the classification tree of GWB partition considering the uncertainty of component quantity

Modeling rules and the information extraction for BIM

The discussion in Section 3 shows that the proposed seismic loss assessment method is suitable for components with different LODs, and more effective information leads to lower uncertainty of the loss assessment result. However, even if a component in a building information model has a high LOD, the information may be difficult to extract correctly, as modeling styles vary with different modelers. Consequently, it is necessary to propose appropriate rules for the modeling process, to ensure that the data in the established model are not only sufficient for the seismic loss assessment, but also easy to extract.

Currently, many software platforms are available for BIM. For clarity, the BIM software mentioned in this work is the widely used Autodesk Revit 2018 [25]; correspondingly, information extraction is based on the Revit API 2018 [26].

The information extraction includes two steps: (1) Obtain the quantity for each type of component in a building information model using the filters provided by the Revit API; and (2) obtain the relevant attributes of the components.

Structural components

The steel moment frame connection is selected as an example for the structural components. According to its classification tree, the information required for the seismic loss assessment is summarized in Table 1. The structural type is identified as a steel moment frame when the material of the beams and columns is set as steel. The number of beams alongside the connection and the beam height can be inferred from the geometry properties and the position of the beams, which can be obtained using the Revit API.

However, the connection type is more complicated. ¡°Connection type¡± refers to the pre-Northridge connection and the post-Northridge connection. The difference between the two connection types is primarily reflected in the detailing. For example, the post-Northridge connection requires the removal of backing bars and the employment of a new type of weld access holes [27]. Therefore, the connection type can be classified by assessing the connection detail. However, the connection detail cannot be directly modeled because the system families of Revit 2018 do not include the relevant family. Therefore, this study recommend installing the official add-in ¡°Autodesk Steel Connections for Revit 2018¡± [28] to model the connection detail using the system families provided in the add-in. Taking the provided system family ¡°Moment connection¡± as an example, a post-Northridge connection is modeled by assigning the cut-type parameter as a contour, and the bottom backing bar as none. Otherwise, a pre-Northridge connection is modeled, as shown in Fig. 10a. The modeling rules above are summarized in Table 1.

Table 1 Required information and modeling rules for steel moment frame connection

Required information

Source of information

Modeling rules

Structural type

Material of beam and column

Use system families: Structure tab ¨C beam ¨C steel; Structure tab ¨C column ¨C steel

The number of beams alongside the connection

Position of beams

No special requirement

Beam height

Geometry properties of beams

No special requirement

Connection type (method 1)

Steel connection parameters

Install the official add-in ¡°Autodesk Steel Connections for Revit 2018¡±. Use the system families provided in the add-in to model the connection. Taking the provided system family ¡°Moment connection¡± as an example, a post-Northridge connection is modeled by assigning the cut type parameter to be Contour and the bottom backing bar to be none. Otherwise a pre-Northridge connection is modeled.

Connection type (method 2)

User-defined parameters

Use system families: Structure tab ¨C connection. Set the ¡°type mark¡± parameter in ¡°Type Properties¡± dialog to be:
A0: Pre-Northridge connection; B0 or B1: Post-Northridge connection

Reduced beam section (RBS) or not (method 1)

Steel connection parameters

Install the official add-in ¡°Autodesk Steel Connections for Revit 2018¡±. Use the system families provided in the add-in to model the RBS. Taking the provided system family ¡°Moment connection¡± as an example, a non-RBS is modeled by assigning the top or bottom flange cut to be none. Otherwise an RBS is modeled

RBS or not (method 2)

User-defined parameters

Use system families: Structure tab ¨C connection. Set the ¡°type mark¡± parameter in ¡°Type Properties¡± dialog to be:

B0: RBS; B1: Not RBS

Modeling the detail for the steel moment frame connection using the add-in ¡°Autodesk Steel Connections for Revit 2018¡±

Modeling the detail for the steel moment frame connection using the add-in ¡°Autodesk Steel Connections for Revit 2018¡±

(a) Cut type

(b) Reduced beam section (RBS)

Fig. 10 Modeling the detail for the steel moment frame connection using the add-in ¡°Autodesk Steel Connections for Revit 2018¡±

For the Revit model built according to the rules above, the detailed information of the connection can be extracted using the Revit API. The ¡°Autodesk Steel Connections for Revit 2018¡± add-in adopts the ¡°Extensible Storage¡± technology to attach this information to the connection elements in the form of a schema data structure. The information is extracted as shown in the following steps: First, a fast filter ElementClassFilter provided by the API is used to obtain a collection of StructuralConnectionHandler elements in the Revit model, which are the connection instances established according to the proposed rules. Second, the schema associated with these instances is obtained. The values of each field in the schema are the attributes of the connection instances. Fig. 11 shows a segment of a C# code that uses the API to extract the detailed information of the connection to determine the connection type:

Segment of C# code for information extraction of the connection and determination of the connection type

Fig. 11 Segment of C# code for information extraction of the connection and determination of the connection type

The method above to determine the connection type (referred to as method 1) requires the direct modeling of the details of the steel moment frame connection. Such a high LOD may increase the modeling complexity. Consequently, an alternative method (referred to as method 2) is proposed herein for the building information model that does not include those details: First, use the system family ¡°connection¡± to represent a steel moment frame connection; second, set the ¡°type mark¡± parameter in the ¡°Type Properties¡± dialog to be A0, B0, or B1, and define A0 to be the pre-Northridge connection, while B0 or B1 to be the post-Northridge connection.

Similarly, for the attribute ¡°whether the beam end is RBS¡±, it is suggested directly modeling the details of the beam end geometry using the ¡°Autodesk Steel Connections for Revit 2018¡± add-in, as shown in Fig. 10b. If such details are not included in the model, the value of the attribute should be assigned by the user. These modeling rules are summarized in Table 1.

Non-structural components

The GWB partition (C1011) is selected as an example for non-structural components. According to its classification tree, the information required for the seismic loss assessment is summarized in Table 2. For the attribute of the stud material, we suggest the following modeling rules for the convenience of information extraction: Use the system family ¡°Basic Wall¡±, set the function to be interior, and assign the stud material to be metal (¡°Metal ¨C Stud Layer¡±) or wood (¡°Wood ¨C Stud Layer¡±). For the height attribute, no special rule is required to obtain it using the API. For the installation attribute, we suggest a user-defined parameter ¡°type mark¡± (Table 2).

Table 2 Required information and modeling rules for GWB partition

Required information

Source of information

Modeling rules

Stud material

Material of the partition stud layer

Use system family ¡°Basic Wall,¡± set the function to be interior, and assign the stud material to be Metal - Stud Layer or Wood - Stud Layer

Height

Geometry properties of the partition

No special requirement.

Installation

User-defined parameters

User defines the installation. Set the ¡°type mark¡± parameter in ¡°Type Properties¡± dialog of the wall to be:

0: Fixed; 1: Laterally braced above; 2: Slip track above with returns; 3: Slip track above without returns.

Non-built-in categories

Revit pre-defines the built-in categories for a large number of components, e.g., beams, columns, walls, pipes, and sprinklers, etc. In this case, all the family types of a given built-in category can be extracted from the building information model using the ElementCategoryFilter provided by the Revit API. Furthermore, the collection of family instances can be extracted using the ElementClassFilter(typeof(FamilyInstance)) function.

Nevertheless, some components (e.g., elevators, air handling units, chillers, and low-voltage switchgears, etc.) still lack the corresponding built-in category in Revit. In this case, two solutions are proposed herein to identify these components, with the air handling unit taken as an example.

Solution 1: Define family subcategory.

Create a custom air handling unit family and family type using the system family ¡°Mechanical Equipment¡± (BuiltInCategory: OST_MechanicalEquipment) as a template. Define a new subcategory named ¡°air handling unit,¡± and specify the subcategory to at least one element inside the custom family. Hence, the collection of family instances of the air handling unit can be obtained using the following steps: (1) Obtain all the mechanical equipment instances of the OST_MechanicalEquipment category by calling the ElementCategoryFilter(typeof(OST_MechanicalEquipment)) and the ElementClassFilter(typeof(FamilyInstance)) functions. (2) Filter out the instances whose family file does not contain the ¡°air handling unit¡± subcategory.

Solution 2: Manually establish mappings.

For each Revit model, call the Revit API functions of ElementCategoryFilter(typeof(OST_MechanicalEquipment)) and ElementClassFilter(typeof(ElementType)) to obtain all the mechanical equipment types of which the category is OST_MechanicalEquipment. Subsequently, the user specifies the types belonging to the ¡°air handling unit.¡± Hence, the collection of family instances corresponding to the specified types can be obtained using FamilyInstanceFilter. To facilitate the user to implement the operation above, a graphical user interface was developed in this work as an add-in integrated in Revit, based on the Revit API and Microsoft Foundation Classes (MFC), as shown in Fig. 12.

Graphical user interface allowing users to manually establish the mappings between an air handling unit and all the available mechanical equipment types in a Revit model

Fig. 12 Graphical user interface allowing users to manually establish the mappings between an air handling unit and all the available mechanical equipment types in a Revit model

Solution 1 above proposes the modeling requirements for custom family files, and the instances of the custom families modeled according to these requirements can be automatically identified. In contrast, solution 2 is relatively more flexible, as it does not contain any requirements for custom family files. Instead, it requires a small amount of manual operations by the users.

The modeling rules and the information extraction for other non-structural components are similar. The details are not shown herein for simplicity.

Case study

The example models

The building information model of a two-story steel moment frame office is selected as an example to illustrate the proposed method. This office building is a benchmark model proposed by East and Bogen [29], and it includes architectural, structural, and mechanical, electrical, and plumbing (MEP) models (Fig. 13). This benchmark model is adopted in this study, as the corresponding building information model is freely assessable online [30]. No other design information is available for the benchmark model. Consequently, it is assumed in this study that the seismic design category [31] of the building is C. This attribute is included in the classification tree for many components (e.g., heating, ventilation, and air conditioning (HVAC) ducts, ceilings, pipes, diffusers, etc.).

Revit models of the benchmark office building

Revit models of the benchmark office building

Revit models of the benchmark office building

(a) Architectural model

(b) Structural model

(c) MEP model (only displaying the HVAC components)

Fig. 13 Revit models of the benchmark office building

To investigate the uncertainty of building seismic loss owing to the completeness of data, three virtual building information models are established based on the benchmark model, as shown in Table 3. The influence of different LODs on seismic loss is relatively complicated, as it not only affects the repair cost of the structural components directly, but also affects the seismic response of the entire building and thus the repair costs of the non-structural components. To control the source of uncertainty and discuss the analysis results more clearly, it is assumed that the type and quantity of structural components of the three virtual buildings are deterministic and identical. The structural information is obtained from the benchmark model (Fig. 13b) through the Revit API.

Table 3 The three models for the case study

Label

The type and quantity for structural components

The type for non-structural components

The quantity of non-structural components

Building A

Deterministic

Indeterministic

Indeterministic

Building B

Deterministic

Indeterministic

Deterministic (except for wall finish)

Building C

Deterministic

Deterministic

Deterministic

Building A is identical to the benchmark model except that all the non-structural components are removed. Consequently, the types and quantities of non-structural components of Building A are indeterministic. The components of Building A are listed in Table A1, which shows that owing to incomplete information, many potential fragility classification numbers exist for each component. The quantity of components is assumed to follow a lognormal distribution, where the median and dispersion are estimated according to the normative quantities given in Appendix F of FEMA P-58 [3].

Building B is identical to the benchmark model except that all the attributes of the non-structural components are removed. Consequently, the types of non-structural components of Building B are indeterministic, and the potential fragility classification numbers for each component are identical to those of Building A. Meanwhile, the quantities of non-structural components of Building B are deterministic, which are obtained by extracting the building information using the Revit API. One exception is the wall finish component because it has to be modeled in Revit as an attribute of the GWB partition component rather than an independent element. Therefore, the quantity of wall finish components in Building B is also indeterministic, and its median and dispersion are identical to those of Building A. The components of Building B are listed in Table A2.

Building C is identical to the benchmark model except that all the necessary component information are added according to the modeling rules described in Section 4, such that the leaf nodes of the classification trees for all the components can be reached. Consequently, the types and quantities of non-structural components of Building C are deterministic. The components of Building C are listed in Table A3, which are obtained by extracting the building information using the Revit API. Taking the HVAC ducting component as an example, the information extraction process is illustrated in Fig. 14. The comparison of the extraction results with the Revit schedule shows a high precision of the information extraction algorithm.

Illustration for the information extraction process of HVAC ducting components

Fig. 14 Illustration for the information extraction process of HVAC ducting components

Structural analysis

The application of BIM in the structural domain is an important topic of research. There are numerous studies on the automatic generation of structural analysis models based on building information models [32-34]. Consequently, the related topics are not discussed in detail herein. Instead, the Industrial Foundation Class (IFC) [35] building model format is exported from Revit and subsequently imported to ETABS 2016 software [36] to establish the structural analysis model directly. Basically, the location of structural components such as the beams and columns can be imported correctly (as shown in Fig. 15), while other properties, such as the materials, sections, and plastic hinges, require manual adjustments. The widely used El-Centro ground motion record at the design basis earthquake (DBE) hazard level is selected as an example. The primary reasons for choosing such a ground motion intensity are as follows:

(1) The Chinese Code for Seismic Design of Buildings [37] defines three hazard levels, i.e., service level earthquake (SLE), DBE, and maximum considered earthquake (MCE). The return periods of the three hazard levels are 50, 475, and 2475 years, respectively. The performance requirement for the DBE is that the structure is repairable after the earthquake. Therefore, it is practical to study the repair cost of the building at this hazard level. In comparison, the SLE hazard level is relatively low that it is unlikely to cause a significant damage. As for the MCE, the seismic intensity is extremely high that avoiding a structural collapse becomes the primary goal instead of reducing the repair cost.

(2) The 475-year return period DBE is also selected as the basis for the Resilience-based Earthquake Design Initiative (REDi) Rating System proposed by Arup cooperation [38].

To validate the imported structural model, the same structural model is manually established using the MSC.Marc finite element software [39]. The results of the nonlinear time-history analysis of the two software are compared. As shown in Fig. 16, the two results are similar.

Structural analysis model established in the ETABS software by importing the IFC-format model exported from Revit

Fig. 15 Structural analysis model established in the ETABS software by importing the IFC-format model exported from Revit

Results of nonlinear time-history analysis (El-Centro ground motion, DBE hazard level)

Results of nonlinear time-history analysis (El-Centro ground motion, DBE hazard level)

Results of nonlinear time-history analysis (El-Centro ground motion, DBE hazard level)

(a) Peak interstory drift ratio

(x-direction)

(b) Peak absolute floor acceleration (x-direction)

(c) The time history of absolute floor acceleration at the 1st floor (x-direction)

Results of nonlinear time-history analysis (El-Centro ground motion, DBE hazard level)

Results of nonlinear time-history analysis (El-Centro ground motion, DBE hazard level)

Results of nonlinear time-history analysis (El-Centro ground motion, DBE hazard level)

(d) Peak interstory drift ratio (y-direction)

(e) Peak absolute floor acceleration (y-direction)

(f) The time history of absolute floor acceleration at the 1st floor (y-direction)

Fig. 16 Results of nonlinear time-history analysis (El-Centro ground motion, DBE hazard level)

The seismic loss assessment results

The seismic loss assessment results of the three building examples are shown in Fig. 17. Comparing the results of Buildings A, B, and C (Fig. 17a), it can be found that as more information is given, the uncertainty of the total seismic loss tends to decrease (the dispersions are 0.38, 0.28, and 0.14, respectively). In addition, even if the only available information are the seismic design category and structural information of the building (i.e., Building A), a preliminary estimation of the seismic loss can be obtained using the proposed method.

In the case study, the estimated median seismic loss of Buildings A, B, and C are close to each other. It is noteworthy, however, that this is a coincidence. Fig. 17b further illustrates the median loss of different components within the buildings. As shown, for Buildings A and B, the median losses of the external non-structural wall are much lower than that of Building C, while the median losses of the wall finish are much higher than that of Building C. These errors are due to insufficient information. Specifically, the error of the repair cost of the external wall is primarily due to insufficient wall type information, while the error of the repair cost of the wall finish is primarily due to insufficient quantity information. Therefore, we suggest establishing a building information model according to the modeling rules proposed in this study, such that the model contains more useful and extractable information. Hence, the accuracy of the seismic loss assessment result can be improved.

Seismic loss assessment results for the three example buildings

Seismic loss assessment results for the three example buildings

(a) Total seismic loss

(b) Median loss of each component

Fig. 17 Seismic loss assessment results for the three example buildings

Conclusions

In this work, a seismic loss assessment method for buildings combining BIM with the FEMA P-58 method was proposed. Based on the classification trees of the components, the determination of the component type and the development of the component vulnerability function with incomplete information were proposed. The modeling rules and the information extraction for BIM based on the Autodesk Revit API were proposed. Finally, 
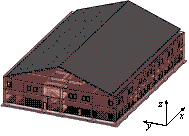
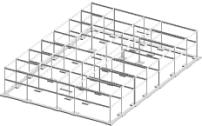
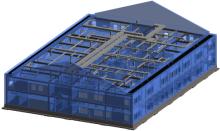
an office building that is accessible online was selected, and the seismic loss assessments with various LODs and BIM data were performed as case studies. The conclusions are as follows:

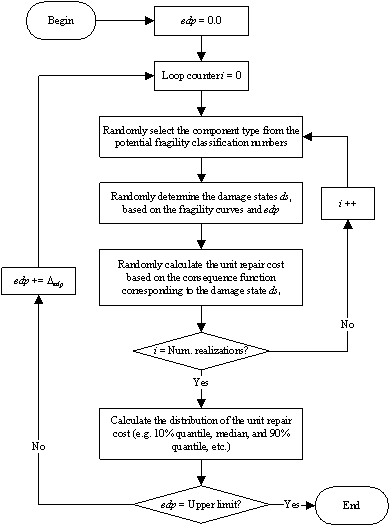
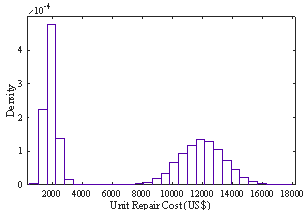
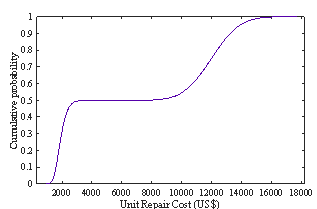
(1) The FEMA P-58 loss assessment method required highly detailed data as its input. The proposed Monte Carlo solution enabled the calculation of the vulnerability function of the components even when the available information was insufficient for a precise classification. Furthermore, if more information was provided, the nodes with higher depths in the component classification tree could be reached, and the uncertainty of the estimated repair cost tended to decrease.

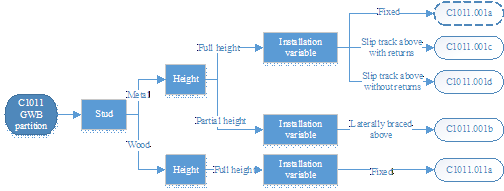
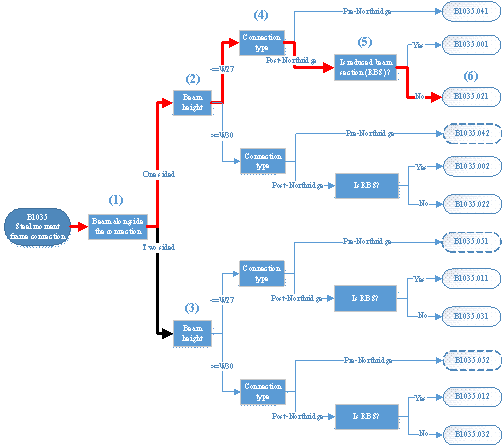
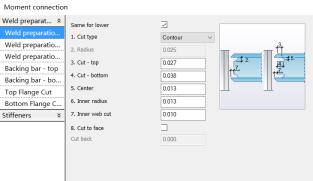
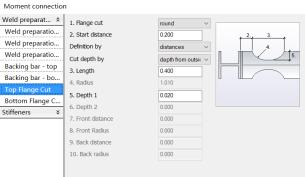
(2) Using components such as the steel moment frame connection and GWB partition as examples, the required information for the FEMA P-58 method was summarized, and the modeling rules and Revit API-based information extraction method were proposed accordingly. 
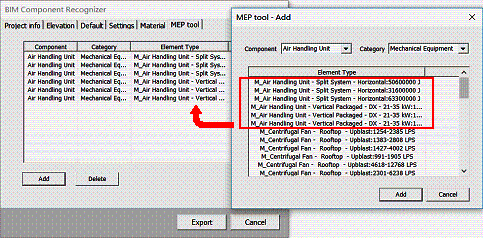
In addition, to identify the components that were not built-in categories in Revit (e.g., air handling unit and low-voltage switchgear, etc.), two solutions were proposed, i.e., custom family subcategory and manual establishment of mappings.

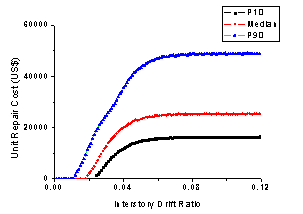
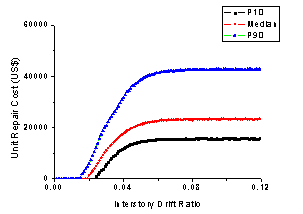
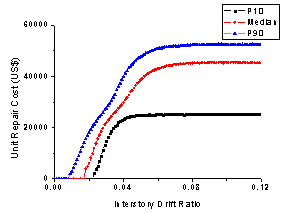
(3) The case study results showed that, on the one hand, even if the available building information was limited, the proposed method could still produce an acceptable loss assessment; on the other hand, given more information, the accuracy of the assessment could be improved and the uncertainty could be reduced using the proposed method.

This study provided a useful reference for the automation of the refined seismic loss assessment of buildings. It is worth noting that the proposed Monte Carlo solution to determining the component types and developing the component vulnerability functions can work for different structural types. However, the proposed modeling rules and information extraction method are rooted in steel moment frame structures and need to be extended if applied for other structural types. In addition, this study assumes the probabilities for the different potential fragility classification numbers are equal for the proposed Monte Carlo solution. Actually, when the relevant prior knowledge is available, such equal probabilities can be adjusted accordingly, which could produce a more accurate loss assessment result.

Acknowledgement

The authors are grateful for the financial support received from the National Natural Science Foundation of China (No.U1709212) and National Key R&D Program of China (No. 2018YFC0809900). The authors are also grateful for the instructions of Professor Stephen Mahin in University of California at Berkeley on pre- and post-Northridge steel moment frame connection.

References

[1] S.H. Hwang, D.G. Lignos, Earthquake-induced loss assessment of steel frame buildings with special moment frames designed in highly seismic regions, Earthq. Eng. Struct. D. 46 (13) (2017) 2141-2162. https://doi.org/10.1002/eqe.2898

[2] X.Z. Lu, X. Zeng, Z. Xu, H. Guan, Improving the accuracy of near-real-time seismic loss estimation using post-earthquake remote sensing images, Earthq. Spectra 34 (3) (2018) 1219-1245. https://doi.org/10.1193/041417EQS072M

[3] Federal Emergency Management Agency (FEMA), Seismic Performance Assessment of Buildings Volume 1 ¨C Methodology. https://www.fema.gov/media-library-data/1396495019848-0c9252aac91dd1854dc378feb9e69216/FEMAP-58_Volume1_508.pdf, 2012 (accessed 13 Jan. 2018).

[4] A.I. Dimopoulos, A.S. Tzimas, T.L. Karavasilis, D. Vamvatsikos. Probabilistic economic seismic loss estimation in steel buildings using post-tensioned moment-resisting frames and viscous dampers, Earthq. Eng. Struct. D. 45 (11) (2016) 1725¨C1741. https://doi.org/10.1002/eqe.2722

[5] T.Y. Yang, J.P. Moehle, Y. Bozorgnia, F. Zareian, J.W. Wallace, Performance assessment of tall concrete core©\wall building designed using two alternative approaches, Earthq. Eng. Struct. D. 41 (11) (2012) 1515-1531. https://doi.org/10.1002/eqe.2219

[6] Y. Tian, X. Lu, X.Z. Lu, M.K. Li, H. Guan, Quantifying the seismic resilience of two tall buildings designed using Chinese and US codes, Earthq. Struct. 11 (6) (2016) 925-942. https://doi.org/10.12989/eas.2016.11.6.925

[7] Z. Xu, Z.C. Zhang, X.Z. Lu, X. Zeng, H. Guan, Post-earthquake fire simulation considering overall seismic damage of sprinkler systems based on BIM and FEMA P-58, Automat. Constr. 90 (2018) 9-22. https://doi.org/10.1016/j.autcon.2018.02.015

[8] T.Y. Yang, M. Murphy, Performance evaluation of seismic force¨Cresisting systems for low-rise steel buildings in Canada, Earthq. Spectra 31(4) (2015) 1969-1990. https://doi.org/10.1193/022314EQS032M

[9] X. Zeng, X.Z. Lu, T.Y. Yang, Z. Xu, Application of the FEMA-P58 methodology for regional earthquake loss prediction, Nat. Hazards 83 (1) (2016) 177¨C192. https://doi.org/10.1007/s1106

[10] A. Henry Oti, W. Tizani, BIM extension for the sustainability appraisal of conceptual steel design, Adv. Eng. Inform. 29 (1) (2015) 28¨C46. https://doi.org/10.1016/j.aei.2014.09.001

[11] K. Sigalov, M König, Recognition of process patterns for BIM-based construction schedules, Adv. Eng. Inform. 33 (2017) 456-472. https://doi.org/10.1016/j.aei.2016.12.003

[12] R.J. Scherer, P Katranuschkov, BIMification: How to create and use BIM for retrofitting, Adv. Eng. Inform. 38 (2018) 54-66. https://doi.org/10.1016/j.aei.2018.05.007

[13] S.K. Lee, K.R. Kim, J.H. Yu. BIM and ontology-based approach for building cost estimation, Automat. Constr. 41 (2014) 96¨C105. https://doi.org/10.1016/j.autcon.2013.10.020

[14] D. Perrone, A. Filiatrault, Automated seismic design of non-structural elements with building information modeling, Automat. Constr. 84 (2017) 166¨C175. https://doi.org/10.1016/j.autcon.2017.09.002

[15] C.A. Cornell, H .Krawinkler. Progress and challenges in seismic performance assessment, PEER Center News 3 (2) (2000) 1¨C3. https://apps.peer.berkeley.edu/news/2000spring/performance.html

[16] J. Moehle, G.G. Deierlein. A framework methodology for performance-based earthquake engineering, Proceedings of the 13th World Conference on Earthquake Engineering, Vancouver, BC, Canada, 2004, paper no. 679. https://www.iitk.ac.in/nicee/wcee/article/13_679.pdf

[17] Applied Technology Council (ATC), Development of next generation performance-based seismic design procedures for new and existing buildings. https://www.atcouncil.org/53-projects/85-atc-58-project, 2016 (accessed 13 Feb. 2018).

[18] G.M.D. Gobbo, M.S. Williams, A. Blakeborough. Seismic performance assessment of a conventional multi-storey building. Int. J. Disasts Risk Sc. 8(3) (2017) 237¨C245. https://doi.org/10.1007/s1375

[19] C. Del Vecchio, M. Di Ludovico, S. Pampanin, A. Prota. Repair costs of existing RC buildings damaged by the L¡¯Aquila earthquake and comparison with FEMA P-58 predictions, Earthq. Spectra 34 (1) (2018) 237-263. https://doi.org/10.1193/122916EQS257M

[20] J.A. Jarrett, J.P. Judd, F.A. Charney, Comparative evaluation of innovative and traditional seismic-resisting systems using the FEMA P-58 procedure, J. Constr. Steel Res. 105 (2015) 107¨C118. https://doi.org/10.1016/j.jcsr.2014.10.001

[21] D. Cardone, G. Perrone, Developing fragility curves and loss functions for masonry infill walls. Earthq. Struct. 9 (1) (2015) 257¨C279. http://dx.doi.org/10.12989/eas.2015.9.1.257

[22] D. Cardone. Fragility curves and loss functions for RC structural components with smooth rebars. Earthq. Struct. 10 (5) (2016) 1181¨C1212. http://dx.doi.org/10.12989/eas.2016.10.5.1181

[23] K. Porter, K. Farokhnia, D. Vamvatsikos, I.H. Cho, Guidelines for component-based analytical vulnerability assessment of buildings and non-structural elements. http://www.sparisk.com/pubs/Porter-2015-GEM-Analytical-Vulnerability.pdf, 2014 (accessed 23 Jan 2018).

[24] BIMForum. Level of development specification for building information models. https://bimforum.org/, 2017 (accessed 23 Dec. 2017).

[25] Autodesk, Revit Built for building information modeling. https://www.autodesk.com/products/revit/overview, 2018 (accessed 12 Jan. 2018).

[26] Autodesk, Online documentation for the Revit API. http://www.revitapidocs.com/2018/, 2018 (accessed 12 Jan. 2018).

[27] Federal Emergency Management Agency (FEMA). Recommended seismic design criteria for new steel moment frame buildings. https://www.nehrp.gov/pdf/fema350.pdf, 2000 (accessed 21 Feb. 2018).

[28] Autodesk, Steel connections for Revit. https://knowledge.autodesk.com/support/revit-products/learn-explore/caas/CloudHelp/cloudhelp/2018/ENU/Revit-AddIns/files/GUID-645A8C55-900A-42A7-8991-BFF6B2C7F6C6-htm.html, 2018 (accessed 12 Jan. 2018).

[29] E.W. East, C. Bogen, An experimental platform for building information research, Proceedings of International Conference on Computing in Civil Engineering, Clearwater Beach, Florida, U.S., 2012, pp. 301¨C308. https://doi.org/10.1061/9780784412343.0038

[30] National Institute of Building Sciences (NIBS), BuildingSMART alliance - common building information model files and tools, https://www.nibs.org/?page=bsa_commonbimfiles, 2017 (accessed 12 Jan. 2018).

[31] American Society of Civil Engineers (ASCE), Minimum design loads for buildings and other structures. https://www.waterboards.ca.gov/waterrights/water_issues/programs/bay_delta/

california_waterfix/exhibits/docs/dd_jardins/DDJ-148%20ASCE%207-10.pdf, 2010 (accessed 15 Jan. 2018).

[32] Z.Z. Hu, X.Y. Zhang, H.W. Wang, M. Kassem. Improving interoperability between architectural and structural design models: An industry foundation classes-based approach with web-based tools. Automat. Constr. 66 (2016) 29¨C42. https://doi.org/10.1016/j.autcon.2016.02.001

[33] A.H. Oti, W. Tizani, F.H. Abanda, A. Jaly-Zada, J.H.M. Tah. Structural sustainability appraisal in BIM. Automat. Constr. 69 (2016) 44¨C58. https://doi.org/10.1016/j.autcon.2016.05.019

[34] T.S. Shin, Building information modeling (BIM) collaboration from the structural engineering perspective. Int. J. Steel Struct. 17 (1) (2017) 205¨C214. https://doi.org/10.1007/s1329

[35] buildingSMART, IFC Overview summary. http://www.buildingsmart-tech.org/specifications/ifc-overview, 2018 (accessed 24 Jan. 2018).

[36] Computers and Structures Inc., ETABS Overview. https://www.csiamerica.com/products/etabs, (accessed 24 Jan. 2018)

[37] Ministry of Housing and Urban-Rural Development (MHURD), Code for Seismic Design of Building (GB 50011-2010), China Architecture Industry Press, Beijing, P.R. China, 2016. (ISBN: 1511228896) (in Chinese).

[38] ARUP, REDi Rating System. https://www.arup.com/perspectives/publications/research/section/redi-rating-system, 2013 (accessed 24 Jan. 2018).

[39] MSC software, Marc: advanced nonlinear simulation solution. http://www.mscsoftware.com/product/marc, 2018 (accessed 21 Jan. 2018)


Table A1 The distribution of components of Building A

Components

Potential fragility classification numbers

Unit

Quantity 1

Dispersion

1st floor

2nd floor

Steel moment frame

B1035.021

Each

10

16

10

28

0

Steel moment frame

B1035.031

Each

28

24

30

6

0

Exterior wall

B2011.011a  B2011.011b  B2011.021a  B2011.021b  B2011.101  B2011.131

m2

270.0

270.0

270.0

270.0

0.6

Interior wall partitions

C1011.001b  C1011.001c  C1011.001d  C1011.011a

m2

1170.0

1170.0

1170.0

1170.0

0.2

Wall finish

C3011.001a  C3011.001b  C3011.001c  C3011.001d  C3011.002a  C3011.002b  C3011.002c  C3011.002d  C3011.003a

m2

88.5

88.5

88.5

88.5

0.7

Stairs

C2011.001b  C2011.011b

Each

1

1

1

1

0.2

Ceiling

C3032.001a  C3032.001b  C3032.001c  C3032.001d

m2

1746.0

1746.0

0

Indepenent pedant lighting

C3034.001  C3034.002

Each

290.6

290.6

0.3

Elevator

D1014.011

Each

0.5

0.5

0.7

Cold or hot water piping

D2021.012b  D2021.022a

m

88.6

88.6

0.2

Chiller

D3031.011a  D3031.011b  D3031.011c  D3031.011d  D3031.012b  D3031.012e  D3031.012h  D3031.012k  D3031.013b  D3031.013e  D3031.013h  D3031.013k

ton

(US)

55.2

55.2

0.1

HVAC ducting

D3041.011b  D3041.021b

m

442.9

442.9

0.2

HVAC ducting

D3041.012b

m

118.1

118.1

0.2

HVAC drops / diffusers

D3041.031b  D3041.032b

Each

174.4

174.4

0.5

Variable air volume box

D3041.041b

Each

38.8

38.8

0.5

HVAC fan

D3041.101a  D3041.102b  D3041.103b

Each

0

0

0

Air handling unit

D3052.011a  D3052.011b  D3052.011c  D3052.011d  D3052.013b  D3052.013e  D3052.013h  D3052.013k

CFM

13562.5

13562.5

0.2

Fire sprinkler water piping

D4011.022a

m

1181.1

1181.1

0.1

Fire sprinkler drop

D4011.032a  D4011.042a

Each

174.4

174.4

0.2

Low voltage switchgear

D5012.021a  D5012.021b  D5012.021c  D5012.021d  D5012.023b  D5012.023e  D5012.023h  D5012.023k

Each

5.8

5.8

0.4

Distribution panel

D5012.031a  D5012.031b  D5012.031c  D5012.031d  D5012.033b  D5012.033e  D5012.033h  D5012.033k

Each

0.8

0.8

0.5

Note: 1. For the cells in the ¡°Quantity¡± column, if there are two lines of numbers, then the first line and the second line represent the quantity in the x direction and the y direction, respectively. For the acceleration-sensitive components, there is only one line of number, as these components are not sensitive to directions.


Table A2 The distribution of components of Building B

Components

Potential fragility classification numbers

Unit

Quantity

Dispersion

1st floor

2nd floor

Steel moment frame

B1035.021

Each

10

16

10

28

0

Steel moment frame

B1035.031

Each

28

24

30

6

0

Exterior wall

B2011.011a  B2011.011b  B2011.021a  B2011.021b  B2011.101  B2011.131

m2

399.0

278.6

316.4

239.0

0

Interior wall partitions

C1011.001b  C1011.001c  C1011.001d  C1011.011a

m2

1379.9

1295.9

962.3

826.5

0

Wall finish

C3011.001a  C3011.001b  C3011.001c  C3011.001d  C3011.002a  C3011.002b  C3011.002c  C3011.002d  C3011.003a

m2

88.5

88.5

88.5

88.5

0.7

Stairs

C2011.001b  C2011.011b

Each

0

2

0

2

0

Ceiling

C3032.001a

m2

454

383

0

Ceiling

C3032.001b

m2

416

167

0

Ceiling

C3032.001c

m2

259

0

0

Ceiling

C3032.001d

m2

367

1071

0

Indepenent pedant lighting

C3034.001  C3034.002

Each

10

4

0

Elevator

D1014.011

Each

1

1

0

Cold or hot water piping

D2021.012b  D2021.022a

m

147.4

143.9

0

Chiller

D3031.011a  D3031.011b  D3031.011c  D3031.011d  D3031.012b  D3031.012e  D3031.012h  D3031.012k  D3031.013b  D3031.013e  D3031.013h  D3031.013k

Each

1

0

0

HVAC ducting

D3041.011b  D3041.012b  D3041.021b

m

767.2

701

0

HVAC drops / diffusers

D3041.031b  D3041.032b

Each

149

96

0

Variable air volume box

D3041.041b

Each

13

8

0

HVAC fan

D3041.101a  D3041.102b  D3041.103b

Each

0

1

0

Air handling unit

D3052.011a  D3052.011b  D3052.011c  D3052.011d  D3052.013b  D3052.013e  D3052.013h  D3052.013k

Each

1

1

0

Fire sprinkler water piping

D4011.022a

m

572.4

485.1

0

Fire sprinkler drop

D4011.032a  D4011.042a

Each

151

141

0

Low voltage switchgear

D5012.021a  D5012.021b  D5012.021c  D5012.021d  D5012.023b  D5012.023e  D5012.023h  D5012.023k

Each

6

3

0

Distribution panel

D5012.031a  D5012.031b  D5012.031c  D5012.031d  D5012.033b  D5012.033e  D5012.033h  D5012.033k

Each

2

0

0


Table A3 The distribution of components of Building C

Components

Potential fragility classification numbers

Unit

Quantity

Dispersion

1st floor

2nd floor

Steel moment frame

B1035.021

Each

10

16

10

28

0

Steel moment frame

B1035.031

Each

28

24

30

6

0

Exterior wall

B2011.011a

m2

399.0

278.6

316.4

239.0

0

Interior wall partitions

C1011.001c

m2

1379.9

1295.9

962.3

826.5

0

Wall finish

-

m2

0

0

0

0

0

Stairs

C2011.001b

Each

0

2

0

2

0

Ceiling

C3032.001a

m2

454

383

0

Ceiling

C3032.001b

m2

416

167

0

Ceiling

C3032.001c

m2

259

0

0

Ceiling

C3032.001d

m2

367

1071

0

Independent pedant lighting

C3034.001

Each

10

4

0

Elevator

D1014.011

Each

1

1

0

Cold or hot water piping

D2021.012b

m

118.1

143.9

0

Cold or hot water piping

D2021.022a

m

29.3

0.0

0

Chiller

D3031.012b

Each

1

0

0

HVAC ducting

D3041.011b

m

764.2

653.8

0

HVAC ducting

D3041.012b

m

3.0

47.2

0

HVAC drops / diffusers

D3041.031b

Each

149

96

0

Variable air volume box

D3041.041b

Each

13

8

0

HVAC fan

D3041.102b

Each

0

1

0

Air handling unit

D3052.013b

Each

1

1

0

Fire sprinkler water piping

D4011.022a

m

572.4

485.1

0

Fire sprinkler drop

D4011.032a

Each

151

141

0

Low voltage switchgear

D5012.021a

Each

6

3

0

Distribution panel

D5012.031a

Each

2

0

0


*Corresponding author.

E-mails: xuzhen@ustb.edu.cn (Z. Xu), luxz@tsinghua.edu.cn (X.Z. Lu), zengx0615@qq.com (X. Zeng), xuyongjia0904@163.com (Y.J. Xu), yili@bjut.edu.cn (Y. Li).

Introduction
Research
Application
Teaching
Publications
Download
Issues
Others


Our Lab

Collapse Prevention Committee