EXPERIMENTAL PROGRAM
Specimen design
General
The prototype structure on which the test specimen is based is a 4-storey and 4ˇÁ4 bay RC flat plate car park, designed in accordance with the Australian Standard on Concrete Structures AS3600 [42] . In the prototype, the RC slab is directly supported by 450 mm square columns that are spaced at a centre-to-centre distance of 6 m in both directions. The height between storeys is 3 m. The design dead load acting on the prototype structure is 6.7 kPa, due to a slab thickness of 270 mm; the design live load is 5 kPa, attributable to a car park under medium vehicle traffic conditions.
Given a limited space in the laboratory, a 1/3 scaled, 2ˇÁ2-bay, substructure extracted from the ground floor of the prototype was constructed and tested. The authors acknowledge that the test results obtained from the scaled specimen will exhibit a size effect when compared to the full-scale prototype, especially for brittle punching shear failure [43, 44] . Nevertheless, this will not influence the load redistribution pattern, which is deemed as one of the most significant mechanisms of progressive collapse, and the overall behaviour of the slab. Published experimental studies on progressive collapse of RC flat plate structures reviewed in the previous Section ˇ°INTRODUCTIONˇ± adopted similar scale factors ranging from 1/4 to 1/2.34. Also note that to minimise the size effect, the aggregate size was reduced to 6 mm in the 1/3 scaled specimen instead of a typical aggregate size of 20 mm in full-scale structures.
Fig. 1 (a) illustrates the extracted region of the substructure encircled by the shaded rectangle. A perspective view of the test specimen with column numbering is shown in Fig. 1 (b), where the slab had an overall dimension of 4,575 mm ´ 4,575 mm ´ 90 mm. Columns had a scaled height of 1,000 mm and were spaced at a centre-to-centre distance of 2,000 mm. In the test specimen, the edges along C3-C9 and C7-C9 had two 500 mm overhangs to simulate the continuity effects of the adjacent slabs. Yet the periphery edges along C1-C3 and C1-C7 were flush with columns, which resembles the flush appearance of the prototype. During casting of the specimen, column C1, which was to be removed in T1, was replaced by a temporary steel column with a rectangular hollow section (RHS). Column C9, which was to be removed in T2, was similar to all other columns and was only cut off prior to applying the UDL in T2 (see Section ˇ°Loading schemeˇ±).
|
|
|
|
(a) |
(b) |
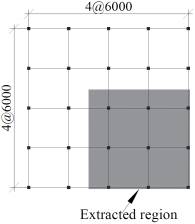
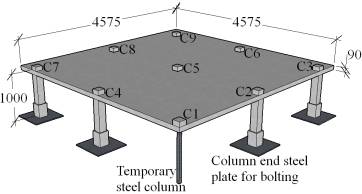
Fig. 1 Specimen details: (a) substructure extraction from the ground floor of the prototype structure; (b) extracted specimen. (Unit: mm)
Steel reinforcement and concrete slab
The slab reinforcing bars of the test specimen should be proportionately scaled down relative to the prototype structure. However, as the required reinforcing bar size was not commercially available, the same reinforcement ratios as those of the prototype structure were adopted for the test specimen. N8 (8 mm diameter and N ductility class (D500N8)) reinforcing bars, with measured (i) yield strength of 564 MPa, (ii) yield strain of 3200 me, (iii) ultimate strength of 786 MPa, and (iv) fracture elongation of 14.9%, were used for the top and bottom slab reinforcements. Detailed slab reinforcement size, spacing, ratio (r) and layout are provided in Table 1 and Fig. 2 (a) and (c). Note that torsional strips (detailed in Fig. 2 (b)) along the slab edges (C1-C3 and C1-C7) were designed to comply with the specifications in AS3600 [42] . The slab had a mean concrete compressive strength of 43.5 MPa at 28 days, measured from six cylinder tests performed in accordance with AS1012 [45] . The nominal clear concrete cover of the slab was 10 mm for both top and bottom layers of reinforcements.
Table 1 . Reinforcement details
|
Strips |
Divided strips |
Top reinforcement |
Bottom reinforcement |
Stirrup |
|
|
Column strip (CS) |
˘Ů |
N8@110 |
¦Ń = 0.49% |
N8@285 ¦Ń = 0.24% |
N/A |
|
˘Ú |
N8@160 |
N/A |
|||
|
Middle strip (MS) |
˘Ű |
N8@250 |
¦Ń = 0.28% |
N/A |
|
|
Edge strip (ES) |
˘Ü |
N8@180 |
¦Ń = 0.61% |
N/A |
|
|
˘Ý |
N8@85 |
R4.75@90 |
|||
Note: strips ˘Ů-˘Ý are graphically shown in Fig. 2 (a). The width of divided strip ˘Ů is equal to twice the slab overall depth plus the column width over which at least 25% of the top reinforcement of the column strip (˘Ů + ˘Ú) has to be distributed [42] .
|
|
|
|
(a) |
(b) |
|
|
|
|
(c) |
(d) |
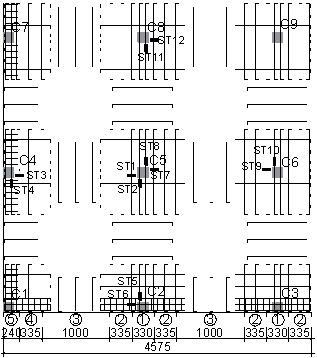

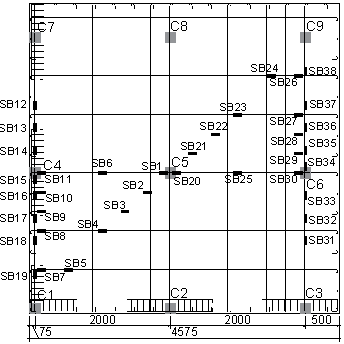
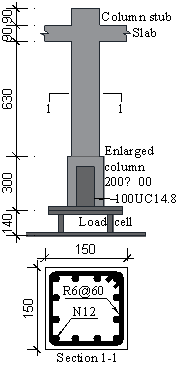
Fig. 2 Reinforcement layout and dimensions of the slab and column: (a) slab top reinforcement; (b) torsional strip details; (c) slab bottom reinforcement; (d) column dimensions and reinforcement details. (Unit: mm)
(Note: ST and SB are strain gauges glued to the top and bottom slab reinforcements, respectively.)
Columns
As typically occurring in construction, the columns were cast first (at least 2 weeks before the slab) and positioned on the strong floor before pouring the slab. The columns had reinforcing bars sticking out to penetrate the slab which reached 80 mm above the top surface of the slab to form a column stub with a height of 90 mm including a 10 mm concrete cover. The top face of the columns was at the same elevation as the bottom surface of the slab formwork. In order to avoid undesirable failure occurring in the columns, a higher concrete compressive strength than the slab (measured as 58.6 MPa at 28 days from six cylinder tests) and an overdesigned reinforcement ratio of 6.8 % were used for the columns. Fig. 2 (d) illustrates an elevation view of a column and its cross-section with reinforcement details. As described above, a 90 mm high column stub was fabricated for each column on the top of the slab to form vertical continuity of the column. A 90 mm high bottom column stub underneath the slab was also fabricated at the removed column C1 in T1. In addition, the bottom of each column was reinforced with a 220 mm high 100UC14.8 steel universal column, itself welded to a 20 mm thick end steel plate, which was used to bolt the specimen to the test rig. This created an enlarged cross-section of 200 mm ˇÁ 200 mm at the bottom of each column to fit the 100UC14.8, which was ribbed using shear connectors to bond to the concrete.
Test setup
UDL applied to the slab
Imposing an increasing UDL either on the entire slab or on those bays adjacent to the removed column is being typically used to evaluate the collapse resistance of flat plates [18, 19, 22] . In this study, the UDL was applied to the slab in two different ways. Firstly, a six-point loading tree (described later in this section) was positioned on the 2,000 mm ´ 2,000 mm bay having the corner column removed and connected to a 250 kN capacity and 600 mm stroke servo-controlled MOOG hydraulic jack. The loading tree with a connection to the hydraulic jack enables the UDL on the bay to be increased until failure of the slab. Secondly, a constant design live load of 5 kPa was applied to the remaining three bays of the slab with overhang(s) through uniformly laying out steel blocks, each with a nominal mass of 125 kg. This loading arrangement follows the design procedure recommended by the DoD [3] , in which the UDL acting on the bay(s) adjacent to the removed column is increased relative to the other bays. Fig. 3 provides an overview of the applied UDL for T1. It is noted that for T2, no constant UDL of 5 kPa was applied to the damaged bay C1-C2-C5-C4, as further discussed in Section ˇ°Loading schemeˇ±.
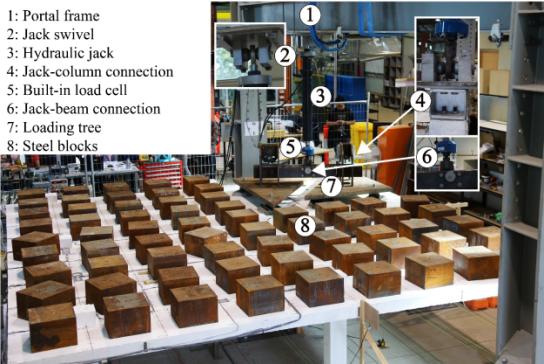
Fig. 3 Overview of T1 setup
Regarding the loading tree, the two ends of the hydraulic jack were mounted on swivels to prevent shear forces being transferred to the hydraulic jack. To evenly transfer the concentrated load from the hydraulic jack to the six loading points, the loading tree was comprised of one horizontal steel RHS beam and two 50 mm thick triangular steel plates. The steel RHS beam was simply supported between the centres of gravity of the steel plates, i.e., one end was allowed to slide through slotted holes manufactured in the support. The load was applied by the hydraulic jack to the mid-span of the steel RHS beam. To ensure a stable loading system, the supports of the steel RHS beam were set below the point of application of this jack load. Two swivels were also used to connect the steel RHS beam to its supports, therefore allowing each steel plate to move independently from each other and follow the deformation of the slab. The three corners of each triangular steel plate were fitted with ball-socket joints (made of a steel ball connected to the steel plate and a 50 mm diameter polyvinyl chloride (PVC) round socket pad with a low friction coefficient) to transfer the load vertically to the slab. To spread the load under each loading point and avoid local failure of the slab, a 300 mm ˇÁ 200 mm, 20 mm thick, steel plate was positioned below each ball-socket joint. Furthermore, to prevent the development of horizontal forces in the slab induced by the loading tree, the horizontal displacements of one loading point of each steel plate were restrained while the remaining two points were allowed to slide in either X- or Y- direction only. Fig. 4 illustrates the features of the loading tree.
|
|
|
(a) |
|
|
|
(b) |
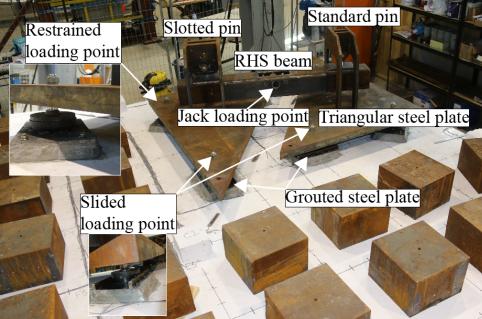
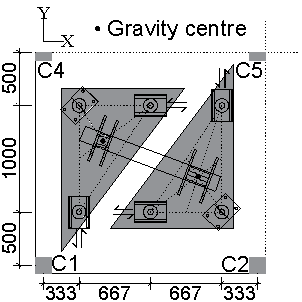
Fig. 4 Loading tree: (a) positioned loading tree on the slab; (b) layout of loading points. (Unit: mm)
Instrumentation
The behaviour of the slab was monitored by custom-made load cells bolted underneath each column, strain gauges (SG), linear variable displacement transducers (LVDT) and rotation transducers (RT). Each custom-made load cell consisted of four independent strain gauged steel circular hollow section (CHS) elements which were rigidly bolted to two steel plates (shown in Fig. 2 (d)). The tension and compression axial forces and bending moments resisted at the column bases were measured by the load cells throughout T1 and T2. Further details of the design of the custom-made load cells can be found in Xue et al. [20] .
Strains for both T1 and T2 were measured by means of 25 strain gauges (ST1-ST6 and SB1-SB19 for T1, and ST7-ST12 and SB20-SB35 for T2) with 3 mm gauge length and 10 strain gauges (CT1-CT6 and CB1-CB4 for T1, and CT7-CT12 and CB5-CB8 for T2) with 90 mm gauge length glued to the steel reinforcing bars and surfaces of the concrete slab, respectively. Strain gauge numbering and locations for each test are given in Fig. 2 (a) and (c) for the reinforcing bars and in Fig. 5 for the slab surfaces.
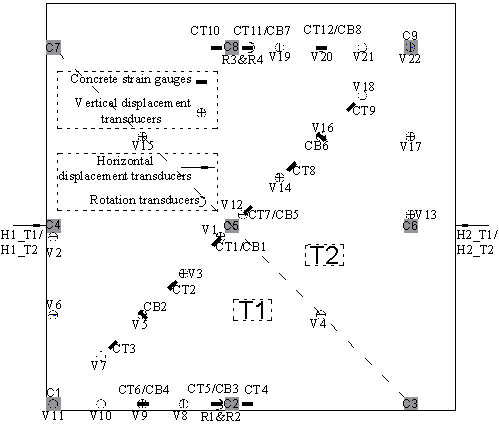
Fig. 5 Strain and displacement measurement points
(Note: CT and CB are concrete strain gauges glued to the top and bottom surfaces of the slab, respectively; V1-V22 are vertical displacement transducers; H1-H2 are horizontal displacement transducers; R1-R4 are rotation transducers measuring the relative rotation between the slab and column.)
The displacement transducers for both T1 and T2 consisted of 11 (V1-V11 for T1 and V12-V22 for T2) wire transducers connected below the slab measuring the vertical displacements of the slab, and two laser transducers (H1-H2) measuring the horizontal displacements of the slab. In addition, four rotation transducers (R1-R2 for T1 and R3-R4 for T2) were mounted on the slab next to columns and on the top of columns to record the relative rotation between the slab and either column C2 or C6. Locations and numbering of all transducers for each test are shown in Fig. 5 .
Due to safety concerns when monitoring the crack developments during Tests T1 and T2, different procedures were implemented to monitor the top and bottom surface cracks of the slab at key stages. For the top crack monitoring, cracks were drawn by an operator walking on the slab while being attached to a safety harness. Photos were also manually taken by the operator. For the bottom crack monitoring, a camera was mounted on a group of tracks parallel to the slab edge enabling the photos of the entire bottom surface to be remotely taken without people going underneath the slab. Using appropriate lighting, even hairline cracks were able to be captured.
Loading scheme
In this study, a quasi-static loading scheme was applied throughout T1 and T2. The loading scheme is divided into four distinct phases detailed below:
Phase 1 ¨C Use of temporary support: The portal frame (Item 1 in Fig. 3 ) was positioned to be aligned with C1-C7 for T1. The hydraulic jack was positioned and pin-connected to the top of the removed column stub. The connecting device is displayed as Item 4 in Fig. 3 . This column stub was lifted by less than 1 mm to remove the underneath temporary steel RHS column. The hydraulic jack was then moved back to its original position and kept at this position in displacement control to simulate an undamaged structure. For simplicity in T2, instead of using the hydraulic jack, a slightly tensioned steel chain was connected from a bridge crane to C9. The column C9 was then cut off and the bridge crane was used as the temporary support.
Phase 2 ¨C Live load and loading tree positioning: The slab was loaded with steel blocks on the other three bays with overhang(s) to simulate the constant live load, and the loading tree, weighing 8.7 kN, was placed in the bay with removed column to simulate increased UDL. Note that the portal frame was laterally moved to the middle span of this bay to re-position the hydraulic jack for the loading tree. Note also that for T2, the steel blocks were not positioned in bay C1-C2-C5-C4 which was already damaged during T1.
Phase 3 ¨C Release of jack-bearing force: In this phase, the column reaction force transferred to the hydraulic jack (T1) or to the bridge crane (T2) in Phase 2 was released to 0 kN quasi-statically.
Phase 4 ¨C Increase of UDL to failure: The portal frame and the hydraulic jack were positioned above the loading tree. The load cells of the hydraulic jack and of each column, all displacement transducers and strain gauges (see Section ˇ°Instrumentationˇ±) were initialised to zero. The hydraulic jack was then pin-connected to the loading tree and the UDL on the slab was increased by driving the hydraulic jack in displacement control. Displacement loading rates for T1 were varied in different stages as below:
ˇ¤ At 1 mm/min up to the displacement of the removed column C1 reaching 143 mm, corresponding to well-developed cracks.
ˇ¤ At 3 mm/min up to the displacement of C1 of 307 mm, corresponding to the load reaching a plateau and failure well developed in the slab.
ˇ¤ At 5 mm/min till the end of the test, i.e., at the displacement of C1 being 409.5 mm.
Displacement loading rates for T2 were also varied in different stages as below:
ˇ¤ At 1 mm/min up to the displacement of the removed column C9 reaching 85 mm, corresponding to the occurrence of punching shear failure at C8.
ˇ¤ At 3 mm/min up to the displacement of C9 of 145 mm, corresponding to the occurrence of punching shear failure at C6.
ˇ¤ At 5 mm/min till the end of the test, i.e., at the displacement of C9 being 475.2mm.
Note that T2 was conducted 12 days after T1 due to installation and connection of required experimental instruments, and cutting of column C9. The tests were not repeated as the results were shown to be repeatable in Xue et al. [20] .
TEST RESULTS AND DISCUSSION
General
Only experimental results arising from Phase 4 (Increase of UDL to failure) are presented and discussed herein. Note that for T1, 2.5 kN was transferred to the hydraulic jack during Phase 2. For simplicity, only displacements and strains at selected key locations are analysed and discussed. To capture the crack developments (see Section ˇ°Instrumentationˇ±), T1 and T2 were paused at key stages at which the drops of the applied load, inherent to pausing a test driven in displacement control, are not showed in the load-displacement curves for clarity.
Overall behaviour
Test T1
Fig. 6 plots the applied load versus column C1 displacement (V11) for T1. Two prominent load resisting stages can be identified, before and after the first peak load (FPL) (see Fig. 6 ):
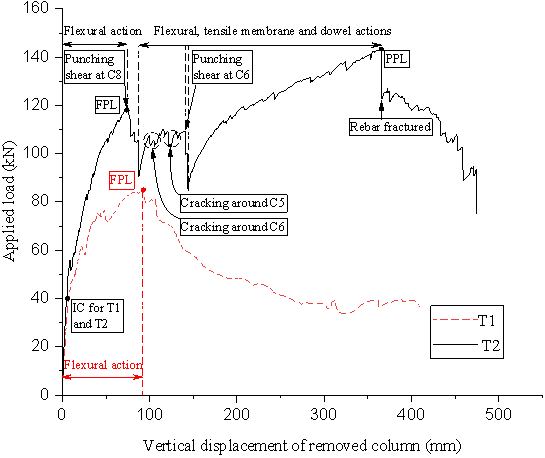
Fig. 6 Load-displacement curves for T1 and T2
(Note: IC, FPL and PPL denote initial cracks, first peak load and post-failure peak load, respectively.)
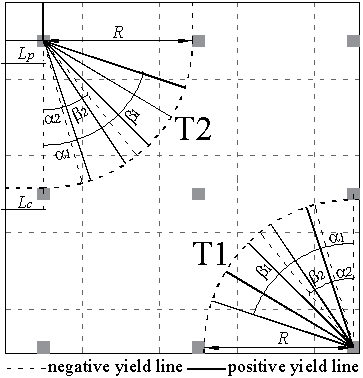
Stage 1 ¨C Flexural action: Up to the FPL, at the onset of the applied load of 85.1 kN and the C1 displacement of 92.8 mm (i.e., approximately one slab depth), the flexural action is regarded as the sole resisting mechanism with opening of small cracks at the top surface of the slab and yielding of the top reinforcements near C2 and C4. Specifically, at the beginning of Stage 1, a linear relationship between the load and displacement can be witnessed in Fig. 6 , up to about 40 kN and the corresponding C1 displacement of 7.1 mm when initial cracks (IC) were observed to develop on the top surface of the slab (Fig. 7 (a)). At the IC, the cracks originated from C2 and C4, and propagated towards C5. A non-linear relationship is then observed, corresponding to cracks further propagating from C2 and C4 to ultimately form complete quarter crack rings at the FPL, as shown in Fig. 7 (b). From the experimental observations and loading history, it is speculated that when quarter rings merged, several load drops of 2.1 kN, 4 kN and 5.1 kN at displacements of 13.6 mm, 21.8 mm and 48.5 mm, respectively were resulted. It is noted that a quarter crack ring propagated beyond the column removal bay C1-C2-C5-C4 to bays C2-C3-C6-C5 and C4-C5-C8-C7. Additionally, positive crack lines (Fig. 7 (d)) at the slab soffit developed from the C1 displacement of 21.8 mm. These positive crack lines are mainly running diagonally, parallel to line C1-C5. After reaching the FPL, almost no new positive crack lines were observed, instead existing cracks became wider as the displacement continued to increase.
|
|
|
|
(a) |
(b) |
|
|
|
|
(c) |
(d) |
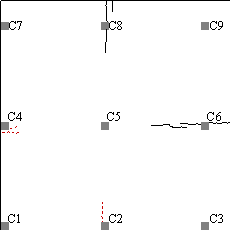
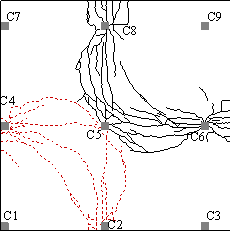
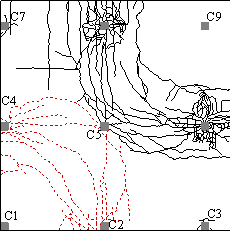
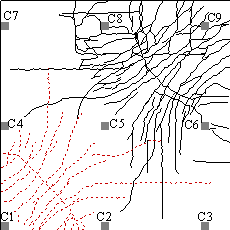
Fig. 7 Crack patterns at top and bottom surfaces of the slab: (a) top surface cracks at IC; (b) top surface cracks at FPL; (c) top surface cracks at final stage; (d) bottom surface cracks at final stage.
(Note: T1 and T2 cracks are shown with dotted red and plain black lines, respectively.)
Stage 2 ¨C Bending failure: The second stage was initiated by a 5.1 kN drop right after reaching the FPL, corresponding to the formation and opening of a new crack ring on the top surface of the slab, located closer to C1 than previously developed rings, as drawn in Fig. 7 (c) in comparison to Fig. 7 (b). Subsequently, cracks along this ring further developed to ultimately penetrate through the entire thickness of the slab corresponding to (i) a sudden 9.1 kN drop of the applied load at the C1 displacement of 106.2 mm, and (ii) yielding of the bottom reinforcement (SB4 and SB17, as described later in Section ˇ°Strain resultsˇ±). Subsequently, the applied load gradually decreased with an increased displacement of C1, matching with cracks opening up further on the top surface (Fig. 8 (a)) and concrete crushing and spalling on the bottom surface (Fig. 8 (b)) along the cracks. The distances measured from column C1 to the full-depth flexural cracks were 1,345 mm and 1,350 mm, respectively, along the two edges of the slab (Fig. 8(a)), which are roughly equivalent to the top reinforcement cut-off positions for C2 and C4 (1,370 mm). At the C1 displacement of about 305 mm when the crack width was sufficiently large, the corner portion of the slab with the removed column C1 was only connected to the remaining substructure by the bottom reinforcement. Afterwards, the detached corner rotated in a rigid body motion around this large crack ring at a relative constant applied load of 39 kN, on average, till the end of the test. According to above experimental observations and results, it is apparent that the failure was mainly localised by the formation of a negative yield line, along which the full-depth flexural cracks developed ultimately.
|
|
|
(a) |
|
|
|
(b) |
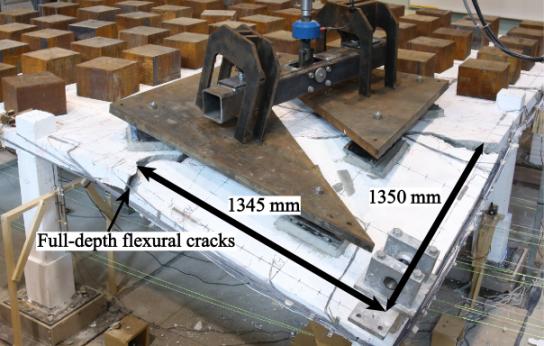
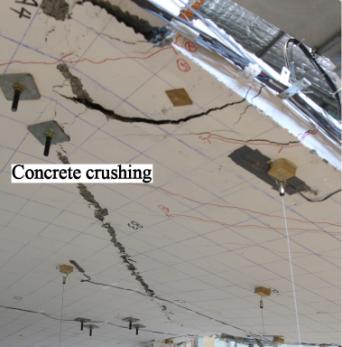
Fig. 8 Failure modes of T1: (a) top view; (b) bottom view.
Test T2
Due to the 500 mm overhang along C3-C9 and C7-C9, a higher load was applied during T2, when compared to T1, to reach failure. Also due to different slab configurations, a different structural behaviour than T1 was observed for T2. It can be summarised in three distinct failure stages:
Stage 1 ¨C Flexural action: Prior to the FPL, the same load resisting mechanism was witnessed in T2, relative to T1. At about 40 kN, the linearity between the load and displacement ended with the initial cracks (IC). The initial stiffness of 8.7 kN/mm for T2 was found to be 1.5 times higher than the one for T1. A similar crack pattern to T1 was observed with the cracks stating from C6 and C8, and propagating towards C5 (Fig. 7(a)). At an applied load of about 56 kN, the load started to increase relatively steadily by about 1 kN/mm up to the FPL at 119 kN. The crack pattern on the top surface of the slab at the FPL for T2 is depicted in Fig. 7(b) and shows that contrary to T1, the ring cracks in T2 mainly developed in the two adjacent bays. This is likely because the reinforced overhangs, providing continuity of the slab, contributed to resisting the applied load by involving the adjacent bays. The cracks at the slab bottom surface in T2 at the FPL present a similar pattern to T1 but are denser and longer, primarily due to the larger positive bending moment. The load drop of 28.5 kN at the FPL with the corresponding C9 displacement of 74.3 mm was the result of punching shear failure occurring at C8, as shown in Fig. 9 (a).
|
|
|
(a) |
|
|
|
(b) |
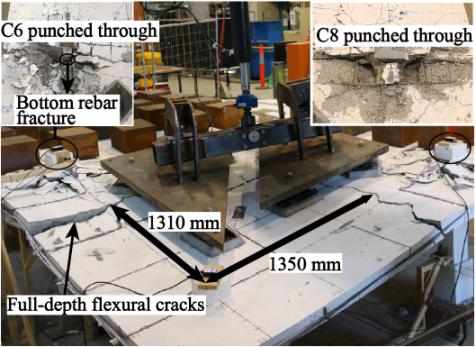
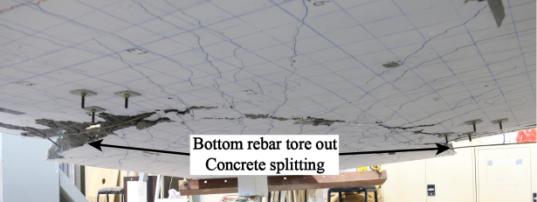
Fig. 9 Failure modes of T2: (a) top view; (b) bottom view.
Stage 2 ¨C Post-FPL: After punching shear occurred at C8, the applied load increased again until punching shear occurred at C6 with the corresponding C9 displacement of 140.6 mm. Specifically, at the beginning of Stage 2, the applied load increased at 1.39 kN/mm to the C9 displacement of 99.9 mm, following that, punching-like cracks around C6 and C5 developed, corresponding to a relatively constant applied load. When punching shear failure ultimately occurred at C6, the applied load dropped by 24.7 kN. From this stage onwards, the load was resisted by flexural and tensile membrane actions, while dowel action allowed C8 and C6 to continue carrying the load. After the C9 displacement of 200 mm, the load increased steadily up to the post-failure peak load (PPL) at a rate of 0.16 kN/mm. The formation of the full-depth flexural cracks was firstly witnessed at the C9 displacement of about 240 mm, indicating a decreased contribution of the flexural action, relative to the tensile membrane action, in resisting the load. The distances measured from column C9 to the full-depth flexural cracks were about 1,310 mm and 1,350 mm, respectively, along the two edges of the slab (Fig. 9(a)), being roughly equivalent to the top reinforcement cut-off positions for C6 and C8 (1,370 mm). Unlike T1, the load carrying capacity continued to increase to the PPL of 143.3 kN after the formation of the full-depth flexural cracks.
Stage 3 ¨C Post-PPL: As the relative displacement between the damaged columns (C6 and C8) and the slab increased, the bottom reinforcing bars passing through these columns were bent considerably. At the PPL, the bottom reinforcing bar running between C6 and C9 fractured (Insert for C6 in Fig. 9 (a)) with a load drop of 20.7 kN. Thereafter, the full-depth cracks were further developed from the slab edge to the interior, which was accompanied by the concrete splitting and the bottom reinforcing bars ripping out of the concrete cover (Fig. 9 (b)). After the PPL, the applied load gradually decreased with an increased displacement of C9 until the test was terminated at the displacement of 475.2 mm. The final crack patterns of T2 can be seen in Fig. 7 (c) and (d).
Load redistribution
The reaction force at each support column was acquired during the two tests through the custom-made load cells. The results for each column are plotted versus the displacement of the removed column in Fig. 10 (a) for T1 and in Fig. 11 (a) for T2. On the other hand, Fig. 10 (b) and Fig. 11 (b) plot the percentages of the applied load distributed to different column groups for T1 and T2, respectively, namely ˇ°adjacentˇ± columns (C2 and C4 for T1 and C6 and C8 for T2), ˇ°interiorˇ± column (C5 for both T1 and T2) and ˇ°boundaryˇ± or ˇ°otherˇ± columns (C3, C6, C7, C8 and C9 for T1, and C2, C3, C4 and C7 for T2).
|
|
|
|
(a) |
(b) |
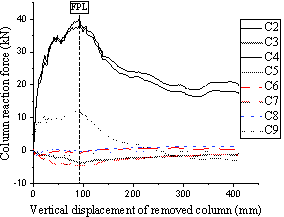

Fig. 10 Load distribution to columns for T1: (a) individual column distribution; (b) percentage distribution.
|
|
|
|
(a) |
(b) |
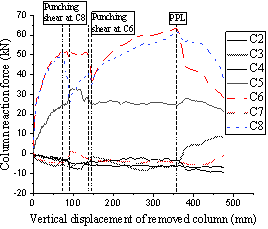
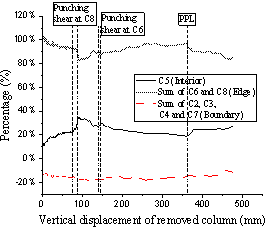
Fig. 11 Load distribution to columns for T2: (a) individual column distribution; (b) percentage distribution.
Fig. 10 and Fig. 11 show that 80% to 110% of the applied load is transferred to the two edge columns adjacent to the removed corner column throughout the entire two tests. A similar finding was found in Xue et al. [20] . In Stage 1 of both tests, 10% to 20% of the applied load was transferred to the interior column C5, while about the same amount was resisted by the boundary columns, but in tension. For T1 and after reaching the FPL, the load resisted by the interior and boundary columns gradually decreased to zero, resulting in the adjacent edge columns carrying the entire applied load. In T2, different behaviours were observed, with the load resisted by the interior and boundary columns being relatively constant after reaching the FPL. Still for T2, after punching shear occurred at C8, about 12% of the applied load was directly transferred to the interior column C5 and another 5% to boundary columns C2, C3, C4 and C7.
During the whole process of load redistributions of the two tests, up to 12.4% in T1 and 18.6% in T2 of the loads were taken in tension by the boundary columns as shown in Fig. 10 and Fig. 11 , relative to the total reaction forces. Therefore, the loads transferred to the boundary columns were not negligible, showing the importance of considering the adjacent bays in the experimental tests to fully replicate the actual collapse behaviour of the slab.
Slab deflection
The readings of the vertical displacement transducers located along the diagonal lines C1-C5 for T1 and C9-C5 for T2 are selected in this section to show the slab deflection at critical stages. Fig. 12 shows that up to FPL for T1 and PPL for T2, the entire bay deforms in a parabolic profile due to the bending deformation imposed to the slab. After these stages and due to the development of the yield lines (between transducer V5 and V7 for T1, and V16 and V18 for T2), any further deformation of the bay is mainly located between the yield line and the removed column.
|
|
|
|
(a) |
(b) |
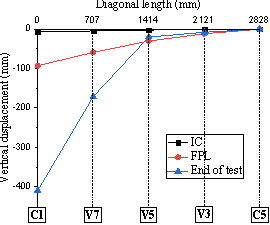
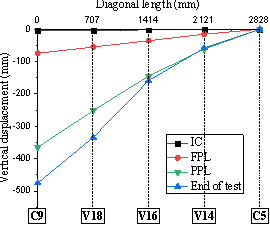
Fig. 12 Slab deflection at key locations along the diagonal line of: (a) T1; (b) T2.
Strain development
Fig. 13 presents the strain results developed in the slab top reinforcing bars for both T1 and T2. The locations of strain gauges on the top reinforcement are depicted in Fig. 2 (a), where the strain gauges for T1 and T2 are symmetrically positioned with respect to the interior column C5, and located at the edge (ST3-ST6 for T1 and ST9-ST12 for T2) and interior (ST1-ST2 for T1 and ST7-ST8 for T2) column regions adjacent to the removed column. When comparing the strains from Gauges ST1, ST2, ST3 and ST5, which stayed below the yield strain ey, the strain readings from Gauges ST4 and ST6 (along and parallel to slab edges) increased rapidly up to the FPL and the bars yielded at the C1 displacement of 37.8 mm. This indicates that the top reinforcing bars contributed to carrying the applied load are mainly the ones perpendicular to the yield lines and located along the slab edges C4-C1 and C2-C1. A similar behaviour was noticed in T2, for which the strains of Gauges ST10 and ST12 also increased rapidly prior to the FPL to reach the yield strain at C9 displacements of 38.2 mm and 51.4 mm, respectively. Contrary to T1, and likely due to different load resisting mechanisms after the FPL, both the strain readings of ST7 and ST8 (located near the interior column C5) exceeded the yield strain after punching shear occurred at C6 and increased significantly to about 16,100 me at the PPL. The strain values of Gauges ST9 and ST11 (located near the edge columns C6 and C8, respectively) increased gradually and became approximately constant after the C9 displacement reaching 325 mm.
|
|
|
|
(a) |
(b) |
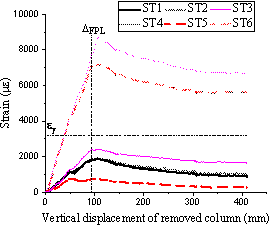
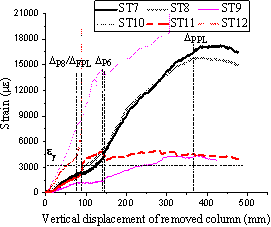
Fig. 13 Top reinforcement strain in: (a) T1; (b) T2.
(Note: DFPL, DPPL, DP6 and DP8 represent displacements at the FPL, PPL, punching shear failure at C6 and punching shear failure at C8, respectively.)
Fig. 14 illustrates the strain readings of the slab bottom reinforcement along the diagonal lines C1-C5 for T1 and C9-C5 for T2 versus the vertical displacement of the removed column. The locations of the strain gauges on the bottom reinforcement are depicted in Fig. 2 (c). The strain gauge readings from SB1-SB4 and SB20-SB23 (all located between the yield lines and the interior column C5) follow the same trend, with the strains being larger when the gauges are located closer to the yield line (SB4 and SB23). For T1, the reading of Gauge SB5, located between the yield line and the removed column C1, showed a low strain of 1,288 me due to the rigid body motion of the failed cantilevered portion of the slab. However for T2, due to the tensile membrane action (see Section ˇ°Stage 2ˇ± in Test T2), the reading of Gauge SB24, also located between the yield line and the removed column C9, showed yielding of the reinforcing bar with a maximum strain value of 4,466 me. Moreover, the strain in the bottom reinforcement along the interior column C5 and edge columns (C4 for T1 and C6 for T2) is found to be considerably higher for SB25 (T2) relative to SB6 (T1), emphasising that the adjacent bays were involved more in resisting the applied load in T2.
|
|
|
|
(a) |
(b) |
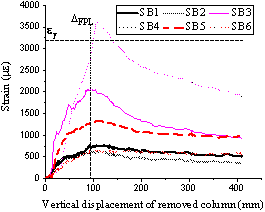
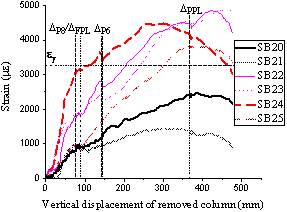
Fig. 14 Bottom reinforcement strain along: (a) C1-C5 in T1; (b) C9-C5 in T2.
The strain readings measured by the gauges on the bottom reinforcement located along lines C1-C4 in T1 and C9-C6 in T2, and glued to the bars perpendicular to the slab edge, are plotted in Fig. 15 . The strain readings for T1 show that none of these bottom reinforcing bars yielded throughout the test. On the contrary, the strain readings for T2 show that after punching shear occurred at C6, all gauges recorded a significant increase, mainly attributable to the effect of tensile membrane action.
|
|
|
|
(a) |
(b) |
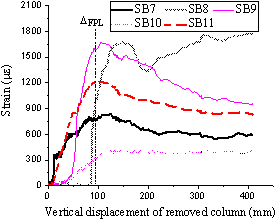
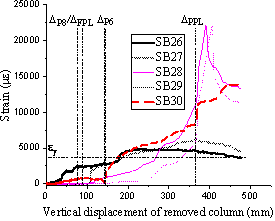
Fig. 15 Bottom reinforcement strain perpendicular to slab edges and orientated along: (a) C1-C4 in T1; (b) C9-C6 in T2.
The remaining strain gauges (SB12-SB19 for T1 and SB31-SB38 for T2) on the bottom reinforcement are used to measure the strain distributions along the integrity bars passing through the edge and corner columns with the gauge locations shown in Fig. 2 (c) and the strain results plotted in Fig. 16 . For T1, it is witnessed that the perimeter integrity bars are in tension, and elongated within the yielding range, except for the strain measured from Gauge SB17 which was mounted at the edge of top reinforcing bar. The strain reading from Gauge SB17 increase rapidly at about the FPL, well coinciding with the experimental observations that large slab bending occurred at the full-depth flexural cracks (near the edge of top reinforcing bars shown in Fig. 8 (a)). For T2, the large strain readings from Gauges SB32 and SB36, symmetrically located relative to column C6, are also due to slab bending. At the interface of the slab-column C6 connection, gauge SB34 was broken just prior to the punching shear failure of column C6, possibly due to the relative displacement between column C6 and the slab.
|
|
|
|
(a) |
(b) |
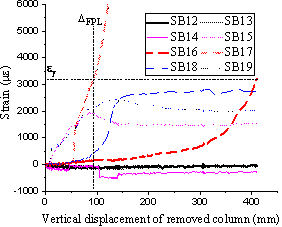
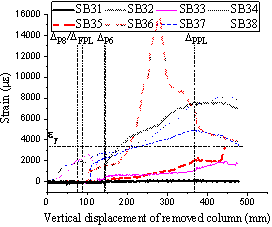
Fig. 16 Bottom reinforcement strain passing through edge and corner columns and parallel to: (a) C1-C4 in T1; (b) C9-C6 in T2.
The strain readings from Gauges SB24, SB26, SB27, SB37 and SB38 in T2 were all found to exceed the yield strain after the C9 displacement reaching to about 234 mm, proving that the tensile membrane action in the cantilevered portion of the slab was induced by the two-way tensile reinforcement net.
Fig. 17 and Fig. 18 show the concrete strain variations of all gauges (shown in Fig. 5 ) on the slab top and bottom surfaces, respectively. To accurately reflect the strain measurements, the gauge readings are only presented up to the displacement of the removed column being 90 mm, as it was observed that the strain gauges were either located across crack openings or isolated by cracks during tests. For T1, the slab top surface was in tension at the column regions (CT1, CT4 and CT5) and the interior slab region (CT2). The strain reading of Gauge CT5 (near column C2) increased rapidly at the initial stage of the loading, agreeing well with the crack pattern at the IC (shown in Fig. 7 (a)). For T2, the strain development shows a very similar pattern to T1, but at a higher intensity evidenced by the measured strains from Gauges CT7, CT8 and CT10 relative to CT1, CT2 and CT4, respectively.
|
|
|
|
(a) |
(b) |
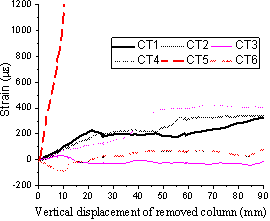
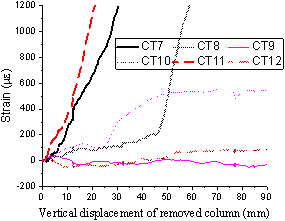
Fig. 17 Concrete strain on top surface of slab in: (a) T1; (b) T2.
|
|
|
|
(a) |
(b) |
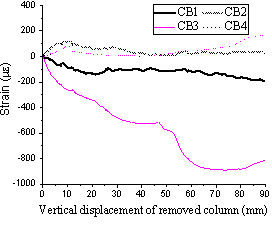
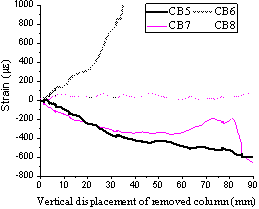
Fig. 18 Concrete strain on bottom surface of slab in: (a) T1; (b) T2.
On the slab bottom surface, Gauges CB1 and CB3 for T1 and Gauges CB5 and CB7 for T2 located near the columns (corresponding to C5 and C2 for T1 and C5 and C8 for T2) were continuously in compression due to slab bending. On the path of C2-C4 in T1 and C6-C8 in T2, Gauges CB2 and CB6 measured in tension. The sharper increase of the strain from Gauge CB6 was possibly attributable to cracks developing across the gauge. The strains of Gauges CB4 and CB8 along the edges of the slab were measured in tension with low magnitudes.