Simulation of the running attitude of a train after derailment

Xiang ZHU 1, Xin-Zheng LU 2*, Qing-Le CHENG 2, Yi LI 3

1 Department of Civil Engineering, Shanxi University, Taiyuan, Shanxi, 030013, China;

2 Key Laboratory of Civil Engineering Safety and Durability of Ministry of Education, Tsinghua University;

3. Key Laboratory of Urban Security and Disaster Engineering of Ministry of Education, Beijing University of Technology, Beijing, 100124, China

International Journal of Crashworthiness, 2019, DOI: 10.1080/13588265.2019.1571749

Download Full Text PDF

Abstract: A derailed train may collide with station buildings, leading to severe consequences. However, studies of this problem are limited. In this work, finite element models of a train, tracks and the ground are built using nonlinear finite element software. The train derailment and the attitude of the train after derailment are simulated with the introduction of an artificial obstacle. The influences of various friction coefficients are discussed. The simulation results show that the friction coefficients of the ground affect the speed and running time of the train after derailment; significant pulling and collision between different carriages of the train are observed. The rear carriages extrude the front ones, causing the train to move with a "snakelike" attitude. The train may collide with objects within a range of 6.68 m from both sides of the tracks.

Keyword: train; derailment; friction coefficient; running attitude

1 Introduction

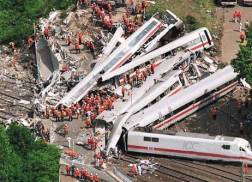
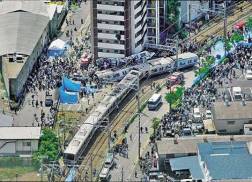
In recent years, there has been a rapid development in high-speed rail construction worldwide. Such a development of railway infrastructure is often accompanied by the severe derailment accidents. Over-speed, impractical railway safety measures, poor weather conditions, and mechanical problems are common causes of train derailment accidents in many countries [1]. These accidents may cause significant casualties and property losses (Figure 1). Derailed high-speed trains, in particular, can collide with surrounding structures, leading to severe secondary disasters. The Amagasaki rail crash was a typical accident. In 2005, having failed to slow down on a curved track properly, five carriages of a high-speed train suddenly derailed on the JR West Fukuchiyama Line in Amagasaki, just in front of the Amagasaki Station on the way to D¨­shisha-mae. The train rushed into a residential building after colliding with a car. This accident killed 107 people and injured 562 others, according to Wikipedia [2].

A

A

(a) A German train derailed causing bridge collapse in 1998 [3].

(b) A Japanese train derailed and collided with high-rise building in 2005 [4].

A Norway train derailed and collided with a building in 2010

An Argentine train derailed and collided with station in 2012

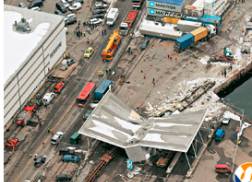
(c) A Norway train derailed and collided with a building in 2010 [5]

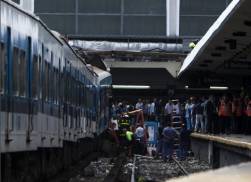
(d) An Argentine train derailed and collided with station in 2012 [6]

A France train derailed and crashed into platform in 2013

A USA New Jersey commuter train derailed and crashed into platform in 2016

(e) A France train derailed and crashed into platform in 2013 [7]

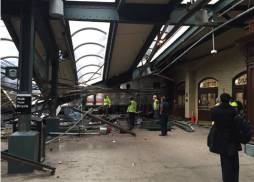
(f) A USA New Jersey commuter train derailed and crashed into platform in 2016 [8]

Figure 1 Train derailment accidents occurred in various countries

In addition to the Amagasaki rail crash, there have been many collision accidents of derailed trains with buildings or bridges, as listed in Table 1. It has become evident that the secondary disasters caused by the collision of a derailed train with buildings or bridges near the tracks are more severe than the train derailment itself. The corresponding collision risk, collision pattern and collision load are closely related to the running attitude of the train after derailments.

Problems associated with train derailment have received increased attention since Nadal [9] firstly proposed the criterion for derailments. Brabie [1] systematically reviewed the relevant studies on the derailment of high-speed trains. In recent years, real accident analyses and early detections of train derailment have been intensively studied [10-12]. However, research to date was primarily focused on how to prevent and monitor train derailments. In contrast, studies of the running attitude of trains after derailment are very limited.

Table 1 Derailed trains collide with buildings leading to secondary disasters

Date

Location

Cause of derailment

Casualties

Building or bridge damage

June 1998

Eschede, near Hanover, Germany

The train tires are broken.

101 people were killed and 88 wounded.

Break the bridge pier, causing the main bridge collapse.

April 2005

Fukuchiyama Line in Amagasaki, Japan

The train is over-speed in the corners.

107 people were killed and 562 wounded.

The collision caused serious damage to the residential building.

March 2010

Oslo, Norway

No traction locomotive, the train slides out of the track

3 people were killed and 3 wounded.

A building collapsed after the derailed trains collide with the building.

February 2012

Buenos Aires, Argentina

Turnout operation error and brake failure

50 people were killed and 703 wounded.

The derailed train collided with the platform.

July 2013

Paris, France

Railway parts are broken.

6 people were killed and 22 wounded.

The derailed train crashed into the platform and damaged the platform.  

September 2016

New Jersey, USA

Train speeding

1 people were killed and 114 wounded

Collapsed portions of the station roof after the crash.

Therefore, an in-depth study of the running attitude of a train after derailment is essential to improve the design, operation, and maintenance of railway systems. The work presents a numerical simulation of the running attitude of a train after derailment based on nonlinear finite element analysis. Using the simulation results, the running attitude of the train after derailment was analyzed with the goal of preventing the secondary disasters caused by derailed trains.

2 Finite element model

2.1 Track model

A key issue when simulating the running attitude of a train after derailment is how to simulate the contact between the derailed train wheels, carriages, tracks and the ground (including the concrete sleeper). Hence, this study used the commercial finite element software package MSC.MARC, which is widely used in contact computation to establish a finite element model [13]. Xu et al. [13-14] have analyzed the collision between over-height truck and bridge superstructure using MSC.Marc. The method of establishing the train model in this work is similar to that Xu et al.¡¯s work [13-14]. In constructing the models, solid elements are used for all main contact bodies mentioned above to ensure the accuracy and reliability of contact simulation. The contact module of MSC.Marc is utilized to definite the contact between different components. Specifically, the contact between the train body, the wheelset, the track and the ground were defined separately. The contact table of MSC.Marc defines the coefficients of friction between the train body, the wheelset, the track and the ground. For the normal contact condition, the contact distance tolerance is set to be zero to avoid any penetrability. For the tangential contact condition (i.e., the friction condition), MSC.Marc provides an arctangent model instead of the Coulomb friction model to improve the convergence efficiency [15]. The expression of which is shown in Equation (1).

(1)

where t is the distance of tangential relative sliding. The value of RVCNST can be seen as the value of the relative velocity below which sticking occurs. The value of RVCNST is important in determining how closely the mathematical model represents the step function.

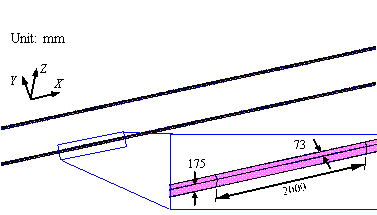
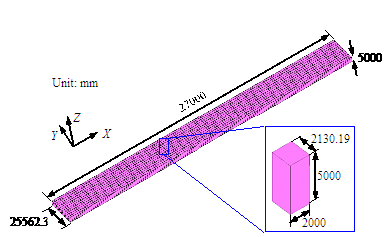
Specifically, the tracks are simulated as a steel material based on an ideal elastic-plastic material according to the von Mises criterion. The concrete sleeper and the ground under the tracks are simulated as concrete material, which is also based on an elastic-plastic material model [16]. The finite element models of the tracks, the concrete sleeper and the ground are shown in Figures 2 and 3, respectively. The shapes of tracks are determined according to their actual sizes. Ballastless tracks are used in this simulation. The tracks and ground are connected through sharing nodes in the finite element model. Han & Koo [17] and Bae et al. [18] showed that the simplification of the tracks has little effect on calculation results.

Finite element model of the tracks (unit: mm)

Figure 2 Finite element model of the tracks (unit: mm)

Finite element model of the ground (unit: mm)

Figure 3 Finite element model of the ground (unit: mm)

2.2 Finite element model of the train

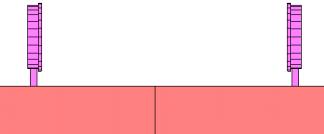
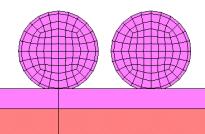
The finite element model of the train has a significant influence on the computational results. To obtain representative results, the parameters of the train model are determined according to a typical Chinese-manufactured train that has eight carriages. The running speed of the train during the derailment accident is set to 80 km/h, which is the highest speed limit in China for a train arriving at the station at the turnout. Hence, the simulation represents the most unfavorable derailed train speed. Solid elements are used to simulate the wheels of the train according to their actual size. The rims of the wheels are simulated as running inside the tracks to more accurately simulate actual conditions on the tracks. The train wheel size is given according to the size of the Chinese-manufactured train wheels. The contacts between wheels and tracks are shown in Figure 4. In MSC.Marc, the initial travel speed of the train can be defined through the Initial Conditions module. Han & Koo [17] showed that the coupler could be simulated with a link unit. Consequently, this work follows Han & Koo [17] method to simulate the coupler as a simple link, and the coupler will not break after the derailment.

Front elevation of the contact between the wheelset and the track

(a) Front elevation of the contact between the wheelset and the track

Side elevation of the contact between the wheelset and the track

(b) Side elevation of the contact between the wheelset and the track

Figure 4 The wheel-rail contact

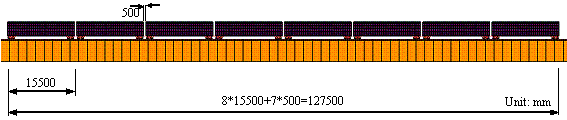
Solid elements are also used to model the car body to achieve an accurate simulation of the train-wheel-track-ground contact. The train models are simplified according to the simulation requirements. The train bogies are simplified using truss elements. The train models are shown in Figures 5 and 6. The lengths of carriages along the x-axis (Figure 5) are 15500 mm. The wheel diameter is 700mm.

Side elevation of the train model

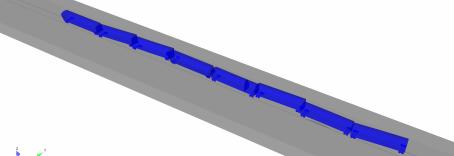
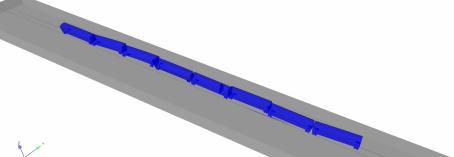
Figure 5 Side elevation of the train model

Plan view of the train model

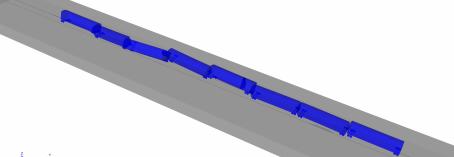
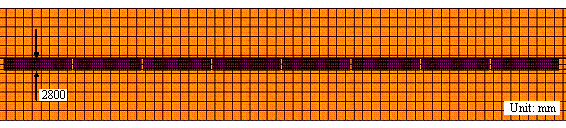
Figure 6 Plan view of the train model

2.3 Boundary conditions

The bottom of the ground was fully fixed. The tracks were connected to the ground through sharing nodes in the finite element model. The entire model was subjected to gravity loads, which were assigned by defining the gravitational acceleration in a vertically downward direction.

2.4 Mesh generation and time step

The x-direction is the running (i.e., longitudinal) direction of the train; the y-direction is transverse to the running direction of the train; and the z-direction is the vertical direction. The sizes of mesh are as follows: the lengths of the elements along the y and z-axes (Figure 6) of the train are approximately 200 mm. The lengths of the elements along the x-axis (Figure 6) of the train are 200 mm to 500 mm. The size of the elements in the wheels is approximately 60 mm. The lengths of the elements along the x-, y-, and z- axis are 2000 mm, 73mm and 175 mm, respectively (Figure 3). This study adopts an implicit algorithm to solve the dynamic equations, and the time step is set to 0.250 ms.

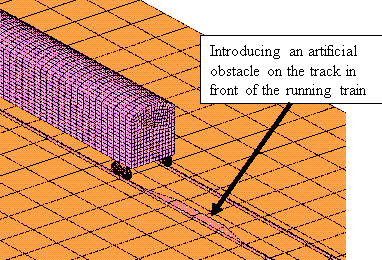
2.5 The train derailment conditions

There are many potential causes of a train derailment because the actual behavior of the wheel-rail system is so complicated. Hence, this study introduces an artificial obstacle on the track, in front of the running train, to induce the train derailment. With this condition, the running attitude of the train after derailment can be simulated. The condition causing the train derailment is shown in Figure 7.

The train derailment condition

Figure 7 The train derailment condition

3 Influence of the friction coefficient on the running of derailed train

At low speed and under dry conditions, the wheel-rail friction coefficient is close to 0.6 [19]. When contaminants, such as water, iron oxide, and leaves, are unintentionally presented on the rail, the friction coefficient will be sharply reduced, to values ranging from 0.05 to 0.1 or even smaller. The relevant information is shown in Table 2. However, when the train contacts the ground after the derailment, the wheel-rail friction coefficient will increase sharply. Therefore, when this work studied the influence of the friction coefficient on the running of the derailed train, the friction coefficients 1.0 and 2.0 were considered to cover a larger parameter range. After the train derails, the wheelsets are in contact with the concrete ground. Rabbat & Russell¡¯s study [20] found that the coefficient of friction between concrete and steel can reach 0.7. Many studies have analyzed the rolling of wheels using different wheel-rail friction coefficients and investigated the influence of different friction coefficients on the motion of wheels [21-23]. Numerous studies have shown that the friction coefficient has a direct influence on wheel-rail contact, which further affects the traction and braking of the train [24]. Therefore, it is necessary to discuss the running attitude of the train after derailment using different friction coefficients. After the train derails, the wheelset will be in contact with the ground, and the friction coefficient between the wheel and the ground is required during the contact process.

Table 2 Friction coefficient with different conditions [19]

Conditions

Temperature (¡⁩

Friction coefficient

Sunshine, dry rail

19

0.6-0.7

Recent rain on the rail

5

0.2-0.3

Much grease on the rail

8

0.05-0.1

Damp leaf film on the rail

8

0.05-0.1

3.1 The influence of different friction coefficients on the running speed of the derailed train

According to the range of wheel-rail friction coefficients and the influence of the ballast on the ground after the derailment, five representative friction coefficients were chosen for analysis in this study; these are 0.1, 0.2, 0.5, 1.0 and 2.0.

The variations of running speed after derailment with different wheel-rail friction coefficients are illustrated in Figure 8. The friction coefficient greatly affects the running speed of the train after derailment. With a higher friction coefficient, the running speed of the train after the derailment will decrease, and the elapsed time before the train stops will also be reduced. However, running speeds after derailment are roughly similar when the friction coefficients are 1.0 and 2.0. This shows that when the friction coefficient is greater than 1.0, it has little influence on the running speed and the running time of the train after derailment.

The speed change of the first carriage with different friction coefficients after the train derailment

Figure 8 The speed change of the first carriage with different friction coefficients after the train derailment

Figure 9 shows the speeds of the first carriage and the train tail after derailment when the wheel-rail friction coefficient is 2.0. The curves are similar to each other. This illustrates a significant pulling-pushing interaction between the front and rear carriages, which causes the whole train to run with nearly the same speed.

The speed change of the first carriage and the train tail after the train derailment

Figure 9 The speed change of the first carriage and the train tail after the train derailment (¦ʼ/i>=2.0)

3.2 The influence of the friction coefficient on the running displacement of the derailed train

From the above analysis, the running speed of a train after derailment will change corresponding to different wheel-rail friction coefficients. Similarly, the running displacement of the train after derailment will also change with different wheel-rail friction coefficients. The running displacement changes after derailment are shown in Figure 10.

The displacement change of the first carriage and the train tail after the train derailment

Figure 10 The displacement change of the first carriage and the train tail after the train derailment

Figure 10 shows that the friction coefficient has a significant influence on the running displacement of the derailed train. With an increase in the friction coefficient, the displacement of the derailed train will decrease gradually, which is consistent with actual experience. When the friction coefficient is greater than 1.0, the derailed train stops after 45 m. When the friction coefficient is smaller than 1.0, the influence of the friction coefficient is more significant. When the friction coefficient is 0.5, the derailed train stops after 60 m. When the friction coefficient is 0.1, the derailed train does not stop even after running for 120 m.

Figure 11 shows the displacements of the first carriage and the train tail after derailment when the wheel-rail friction coefficient is 0.5. The train¡¯s front and rear carriages have a similar displacement after the derailment. This illustrates a significant pulling-pushing interaction between different carriages.

The displacement change of the first carriage and the train tail after the train derailment

Figure 11 The displacement change of the first carriage and the train tail after the train derailment (¦ʼ/i>=0.5)

3.3 The influence of the friction coefficient on the lateral displacement of the derailed train

The friction coefficient has a significant influence on the running speed and displacement of the derailed train. Therefore, it is necessary to consider the impact of the friction coefficient on the lateral oscillation of the derailed train. Table 3 illustrates the maximum lateral oscillation displacements that occur with different friction coefficients. There is a significant lateral oscillation of the derailed train. When the friction coefficient is 0.2, the maximum lateral oscillation displacement is 6.685 m. The maximum lateral oscillation displacements with other friction coefficients approach approximately 3 m, which makes it quite possible that the train will collide with objects and buildings near the track, subsequently inducing secondary disasters.

Table 3 The maximum lateral displacement with different friction coefficients

Friction coefficient ¦ʼ/i>

Maximum lateral displacement (m)

¦ʼ/span>=2.0

3.05

¦ʼ/span>=1.0

2.202

¦ʼ/span>=0.5

2.575

¦ʼ/span>=0.2

6.685

¦ʼ/span>=0.1

3.172

Using the same wheel-rail friction coefficient, the lateral displacements of the first carriage and the train tail after the derailment are shown in Figure 12. There are significant lateral oscillations of both the front and rear carriages. According to EN1991-1-7 [25], for permanent buildings across or near railways in operation, if the distance between the nearest rail center line and the permanent building is not greater than 5 m, it is necessary to consider the possibility of a train running into these buildings after derailment and to take appropriate measures to protect the buildings. EN1991-1-7 [25] does not consider that a derailed train may impact buildings at a distance of greater than 5 m from the center line. However, Table 3 shows that when the friction coefficient is 0.2, the maximum lateral oscillation displacement is 6.685 m, which is beyond the range specified in EN1991-1-7 [25].

Friction coefficient equal to 2.0

(a) Friction coefficient equal to 2.0

Friction coefficient equal to 1.0

(b) Friction coefficient equal to 1.0

Friction coefficient equal to 0.5

(c) Friction coefficient equal to 0.5

Figure 12 The lateral displacement change of the first carriage and the train tail after the train derailment

3.4 The influence of the friction coefficient on the lateral oscillation speed of the derailed train

The lateral oscillation speed of the derailed train is a critical factor that determines the value of the force when the train collides with station buildings. The lateral oscillation speeds of a derailed train with different friction coefficients and lateral displacements are presented in Table 4, which can provide a useful reference for determining the lateral collision speed of a derailed train.

Table 4 Lateral speed with different friction coefficients and lateral displacements

Friction coefficient

Lateral displacement s(m)

¡۰.5

¡۱

¡۲

¡۳

3~5

¦ʼ/span>=2.0

Lateral speed v (m/s)

9.76

13.9

16.4

5.8

3.68

¦ʼ/span>=1.0

Lateral speed v (m/s)

9.15

9.7

6.6

0

0

¦ʼ/span>=0.5

Lateral speed v (m/s)

8.91

8.7

7.1

0

0

¦ʼ/span>=0.2

Lateral speed v (m/s)

9.46

10.2

8.6

6.9

2.1

¦ʼ/span>=0.1

Lateral speed v (m/s)

7.69

3.2

8.0

1.2

0.9

The distance between the station building columns in large-scale Chinese railway stations and the nearest track is fixed. The distance from the center of the through line to the surface of the station building columns is 2.44 m to 2.6 m. The distance from the arrival and departure line to the surface of the station building columns is 2.15 m to 2.25 m. Considering the width of the train, it is conservative to anticipate a collision between the derailed train and the station building columns within a range of 0.5 m from both sides of the tracks.

4 The running attitude after the train derailment

The final running attitudes of the train after the derailment, with different friction coefficients, are presented in Figure 13. The derailed train moves with a "snakelike" attitude. The lateral running attitudes and amplitudes are random to some extent. As shown in Table 3, when the friction coefficient is 0.2, the maximum lateral oscillation displacement is 6.685 m. When the friction coefficient is 2.0 or 0.1, the maximum lateral oscillation displacement is approximately 3 m. When the friction coefficient is 1.0 or 0.5, the maximum lateral oscillation displacement is approximately 2.5 m.

The running attitude of the train after derailment with different friction coefficients

(a) ¦ʼ/i>=2.0

The running attitude of the train after derailment with different friction coefficients

(b) ¦ʼ/i>=1.0

The running attitude of the train after derailment with different friction coefficients

(c) ¦ʼ/i>=0.5

The running attitude of the train after derailment with different friction coefficients

(d) ¦ʼ/i>=0.2

The running attitude of the train after derailment with different friction coefficients

(e) ¦ʼ/i>=0.1

Figure 13 The running attitude of the train after derailment with different friction coefficients (t = 0.8 s)

5 Conclusions

The nonlinear finite element method was used to analyze the running attitude of a train after the derailment. The influences of different friction coefficients were discussed, and conclusions can be derived as follows:

(1) The wheel-rail friction coefficient has a significant influence on the speed and displacement of the derailed train. The greater the friction coefficient, the faster the speed of the train will reduce. However, the friction coefficient has little influence on the reduction of speed and the maximal displacement of the derailed train when it is greater than 1.0.

(2) The speeds and displacements of the first carriage and the train tail after derailment change similarly. This illustrates a significant pulling-pushing interaction between the front and rear carriages, which makes the speed and longitudinal displacement of the whole train almost identical.

(3) There is a significant lateral oscillation of the train after the derailment, which eventually causes the complete derailment of some carriages. The train may collide with objects within a distance of 6.685 m from both sides of the tracks. Hence, actions need to be taken to protect objects within this range.

The running attitude of a train after derailment analyzed in this work will assist in providing a useful reference for the prevention of secondary disasters caused by the collision of derailed trains with station buildings.

Acknowledgements

The research in the paper is supported by the National Natural Science Foundation of China (NSFC) (71741024), and Southeast University, Key laboratory of concrete and prestressed concrete structure of Ministry of Education (CPCSME2016-11).

Disclosure statement

No potential conflict of interest was reported by the authors.

References

[1] D. Brabie. Analysis of vehicle features influencing derailment processes and consequences [dissertation]. Stockholm: Royal Institute of Technology, 2007.

[2] Amagasaki rail crash [Internet]. USA: Wikipedia; [cited 2005 Apr 25]. Available from: https://en.wikipedia.org/wiki/Amagasaki_rail_crash

[3] 100 dead in German train wreck [Internet]. New York: CBS NEWS; [cited 1998 Jun 3]. Available from: https://www.cbsnews.com/news/100-dead-in-german-train-wreck/.

[4] Japan Train Derailment [Internet]. New York: CBS NEWS; [cited 2005 Apr 25]. Available from: https://www.cbsnews.com/pictures/japan-train-derailment/

[5] At least 3 dead in Norway train derailment [Internet]. Atlanta: CNN; [cited 2010 Mar 24]. Available from: http://news.blogs.cnn.com/2010/03/24/at-least-3-dead-in-norway-train-derailment/comment-page-1/

[6] 2012 Buenos Aires rail disaster [Internet]. USA: Wikipedia; [cited 2012 Feb 22]. Available from: https://en.wikipedia.org/wiki/2012_Buenos_Aires_rail_disaster

[7] At least 6 dead in Paris train crash [Internet]. Virginia: USA Today; [cited 2013 Jul 12]. Available from: https://www.usatoday.com/story/news/world/2013/07/12/paris-train-derails/2512431/

[8] Hoboken train crash: 1 dead, more than 100 injured [Internet]. Atlanta: CNN; [2016 Sep 30]. Available from: http://edition.cnn.com/2016/09/29/us/new-jersey-hoboken-train-crash/index.html.

[9] M. J. Nadal. Theorie de la stabilite des locomotives, Part II. Mouvement de lacet, Ann. Min., 10 (1896), pp. 232.

[10] C. Hung, Y. Suda, M. Aki, et al. Study on detection of the early signs of derailment for railway vehicle. Vehicle System Dynamics, 48(S) (2010), pp. 451-466.

[11] F. Zakar, E. Mueller. Investigation of a Columbus, Ohio train derailment caused by fractured rail. Case Studies in Engineering Failure Analysis, 7 (2016), pp. 41-49.

[12] X. Liu, M. R. Saat, C. P. L. Barkan. Freight-train derailment rates for railroad safety and risk analysis. Accident Analysis & Prevention, 98 (2017), pp. 1-9.

[13] L.J. Xu, X.Z. Lu, S.T. Smith, S.T. He. Scaled model test for collision between over-height truck and bridge superstructure. Int. J. Impact Eng., 49 (2012), pp. 31-42.

[14] L.J. Xu, X.Z. Lu, H Guan and et al. Finite-element and simplified models for collision simulation between over height trucks and bridge superstructures. J Bridge Eng, 18(11) (2013), pp. 1140-1151.

[15] MSC.Sofware Corporation. MSC.Marc user¡¯s manual (volume A theory and user information). USA: MSC.Sofware Corporation, 2005, pp. 8-35.

[16] D. Brabie. On the Influence of Rail Vehicle Parameters on the Derailment Process and its Consequences [dissertation]. Stockholm: Royal Institute of Technology, 2005.

[17] H S Han, J S Koo. Simulation of train crashes in three dimensions. Vehicle System Dynamics, 40(6) (2003), pp: 435-450.

[18] H U Bae, K M Yun, N H Lim. Containment capacity and estimation of crashworthiness of derailment containment walls against high-speed trains. Proceedings of the Institution of Mechanical Engineers, Part F: Journal of Rail and Rapid Transit, 232(3) (2018), pp. 680-696.

[19] R. Lewis, U. Olofsson, eds. A Wheel-rail interface handbook. UK: Woodhead publishing limited; 2009.

[20] B G Rabbat, H G Russell. Friction coefficient of steel on concrete or grout. J of Structural Eng, 111(3) (1985), pp. 505-515.

[21] J. J. Kalker, J. Piotrowski. Some new results in rolling contact. Vehicle System Dynamics, 18(4) (1989), pp. 223-228.

[22] W.H. Zhang, J.Z. Chen, X.J. Wu, X.S. Jin. Wheel/rail adhesion and analysis by using full scale roller rig. Wear, 253(1) (2002), pp. 82-88.

[23] Y. Zhu. Adhesion in the wheel-rail contact [dissertation]. Stockholm: Royal Institute of Technology, 2013.

[24] G. I. Alarc¨®n, N. Burgelman, J. M. Meza, et al. The influence of rail lubrication on energy dissipation in the wheel/rail contact: A comparison of simulation results with field measurements. Wear, 330 (2015), pp. 533-539.

[25] European Committee for Standardization. Eurocode1-Actions on structures-Part 1-7: General actions- Accidental actions. London: The British Standards Institute (BSI); 2006. Standard No. BS EN1991-1-7:2006.

Introduction
Research
Application
Teaching
Publications
Download
Issues
Others


Our Lab

Collapse Prevention Committee