|
The collapse
of buildings is a dynamic process. So the pushover analysis, which is widely
used in early performance-based earthquake engineering [5]
[6] ,
is not suitable for the collapse analysis. On the contrary, incremental
dynamic analysis (IDA), which is proposed by Bertero [7]
, analyzes the time-history transient elastic-plastic response of whole
structure with step by step increased intensity, which gives a more realistic
simulation for the collapse process. However, the results of IDA are highly
depended on the selection of ground motion records. A rational set of ground
motion records is critical for IDA. So in this research, the 22 far-field ground
motion records, which is proposed by ATC-63 Project [8] , together with
El-Centro record, which is very familiar for earthquake engineering, are adopted
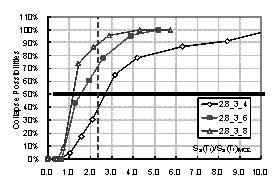
to implement the IDA based collapse analysis. If the total number of ground
motions are Ntotal, and under a certain intensity (in this work Sa(T1),
which is the 5% damped spectral acceleration at the structure��s first-mode period,
is used to represent the ground motion intensity[9]
-[12]), there are Ncollapse ground motions induce the collapse of
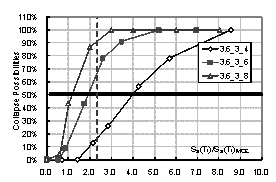
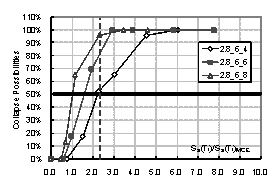
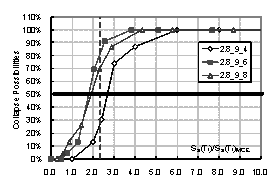
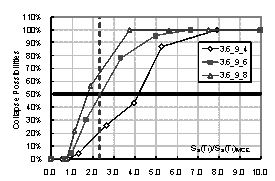
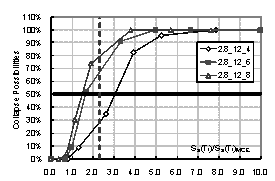
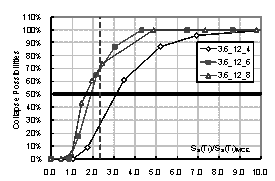
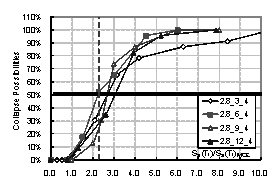
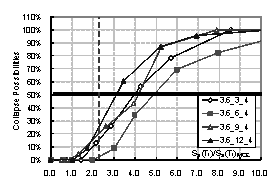
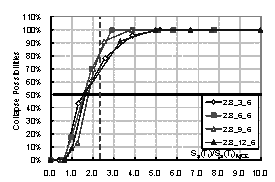
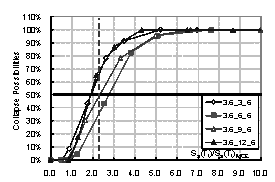
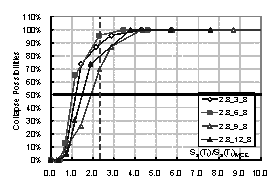
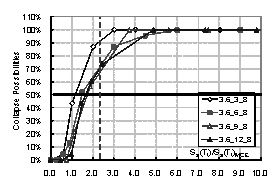
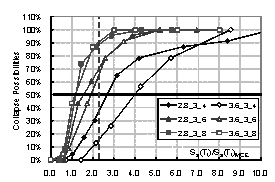
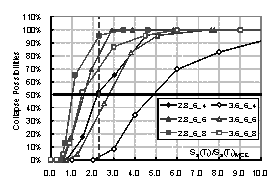
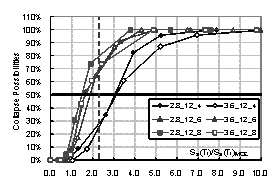
the structure. Then the collapse possibility will be Ncollapse / Ntotal. By increasing the intensity of ground motion, the relationship between
intensity and the collapse possibility can be obtained, which is the collapse
fragility curve of the structure. The collapse fragility curve could give a
quantitative evaluation of seismic collapse resistance.
2.2 Collapse
margin ratio
A collapse resistance
index that is referred as collapse margin ratio (CMR) [8] is proposed
by Applied Technology Council of USA, which is defined by
 (1)
(1)
where Sa(T1)50% is the intensity that causes 50% of collapse according to the collapse
fragility curve, and Sa(T1)MCE is the intensity of maximal considered earthquake (MCE), which can
be found from Table 5.1.4-1 in the Chinese Seismic Design Code.
CMR is an index
for the evaluation of seismic collapse resistance based on probability theory
which has already considered the influence of earthquake uncertainty. Therefore,
although CMR analysis still has some problems (e.g. whether the representative
of ground motion records is sufficient, whether the numerical model of collapse
is reasonable), it provides a relatively reliable standard to the collapse resistance
evaluation of different structures.
2.3 THUFIBER program and collapse criterion
The collapse
of structures is a complex nonlinear dynamic process. Traditionally, because
of the limitation of computational capacity, indirect methods, such as the ultimate
inter-story drift, are generally adopted as collapse criterion, which is not
rational. For example, the ultimate inter-story drift in the Code of different
countries (e.g. China and America) may have a quite big difference. As the computation
method developed, nonlinear analysis program now can simulate the entire nonlinear
process of structural collapse accurately, with material nonlinearity, geometric
nonlinearity and contact nonlinearity considered. This paper adopts THUFIBER
program, developed by Tsinghua University based on MSC. MARC, to simulate collapse
of structures [13][14][15]. THUFIBER program can stably simulate the entire
process of collapse of complex RC structure during earthquake, whose details
are shown in Ref [13][14][15] . Therefore,
this paper takes the real physical definition of collapse, which is: ��Structure
loses so much vertical strength that it cannot preserve sufficient space for
people to live in safely�� as the collapse criterion.
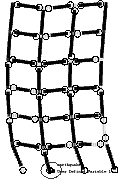
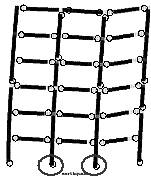
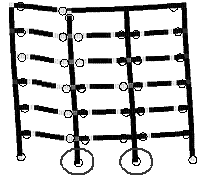
3.
Structural models and parameters
|
 Download
PDF version
Download
PDF version