2. Pseudo-Static Collapse Experiments
2.1. Design of Half-Scale Prototype
This research focused on the investigation of the collapse mechanisms of RC frames damaged during the Wenchuan earthquake. The frames concerned were constructed in accordance with the 2001 version of the Chinese Seismic Design Code [CMC, 2001]. A prototype model, i.e. a 3-span 6-story RC frame, is herein designed following the Chinese codes [CMC, 2001, 2002]. The prototype frame is located on a site with a seismic design intensity of seven (the peak ground acceleration (PGA) is 200 cm/s2 for 10% probability of exceedance in 50 years) and a site classification of II (i.e., an equivalent shear-wave velocity of 360 m/s for 30 m soil (VS30)). The dimensions and design strengths of the prototype frame are summarized in Table 1. The dead and live loads are 4.6 kN/m2 and 2.0 kN/m2, respectively. According to the Chinese Code for Seismic Design of Buildings (GB50011-2001) [CMC, 2001], the design axial load ratio calculated using Eq. (1) is found to be approximately 0.8 for the middle column on the first story.
![]() (1)
(1)
in which n is the design axial load ratio; DL and LL are respectively the dead load and live load of the building for seismic design; gDL (= 1.2) and gDL (= 1.4) are the partial factors for dead load and live load, respectively; fc is the concrete compressive strength; gc (= 1.4) is the partial factor of concrete strength. Note that the actual axial load ratio without considering the partial factors is approximately 0.395. The corresponding axial forces are approximately 1304 kN in the prototype and 326kN in the test frame, respectively. The PKPM [CABR, 2010] software is employed to perform reinforcement design.
TABLE 1: Dimensions and design strengths of the prototype frame
|
Clear height of the column |
Clear span of the beam |
Cross sectional dimension |
Design strength |
|||
|
Columns |
Beams |
Concrete |
Longitudinal steel |
Stirrup |
||
|
3.3 m |
6 m |
400 mm¡Á400 mm |
250 mm¡Á500 mm |
30 MPa |
300 MPa |
210 MPa |
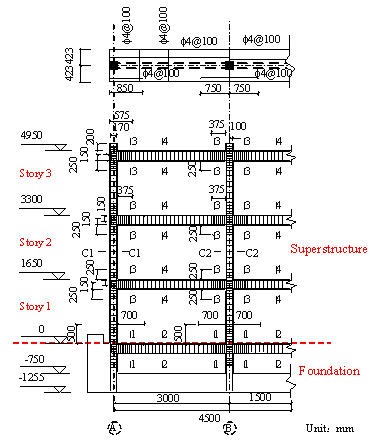
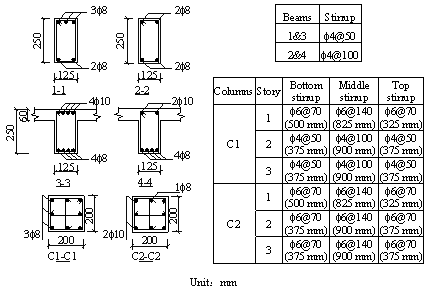
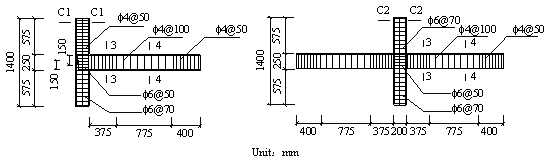
To better represent the behavior of the real structure, the size of the model is designed as large as possible to make full use of the loading capacity of the testing equipment. Considering the height limitation of the strong reaction wall in the laboratory, a half-scaled model is adopted. Such scale is also used by other researchers [Elwood and Moehle, 2008]. The dimensions and reinforcement details of the scaled model are presented in Figure 1. The load pattern of the experiment is illustrated in Figure 2(a), where the upper three stories are simplified into four concentrated loads applied downward by two vertical actuators and two load-distributing girders. Each actuator provides a 489 kN vertical load at the one-third point of the corresponding load-distributing girder, which makes a 2:1 proportion of the axial forces in the middle-columns (Columns 2 and 3) and those in the side-columns (Columns 1 and 4). Rollers, as shown in Figure 2, are installed to ensure that the vertical actuators could translate horizontally together with the roof. The vertical loads provided by the actuators are measured throughout the test. The maximum variation of the axial loads during the test is less than 2% of the expected axial load, suggesting that the actuators are able to stably provide constant vertical loads. The proportion of the designed seismic forces from the sixth to the first story of the prototype is 6:5:4:3:2:1. Note that only the bottom three stories are tested, therefore all of the seismic forces sustained by the upper three stories are applied to the top of the third story. Hence, three cyclic lateral loads with a proportion of 18:2:1 are applied by the three horizontal actuators at the third, second and first story to conduct a cyclic static experiment, as illustrated in Figure 2(a). Figure 2(b) shows the experimental setup of the scaled frame. Four laterally restrained braces are used to limit the out-of-plane displacement of the frame. The entire loading process is controlled by the displacement of the top floor, and a mixed control test program is adopted to ensure the proportionality of three horizontal loads. The lateral loading are selected in accordance with the protocols specified in the Specification of Testing Methods for Earthquake Resistant Building (JGJ 101-96) [CMC, 1997], as shown in Figure 2(c).
Prior to the experiment, concrete cubes of 150 ¡Á 150 ¡Á 150 mm were casted and tested in accordance with the provisions of the Standard for Test Method of Concrete Structures (GB50152-2012) [CMC, 2012]. The measured compressive strengths are given in Table 2. The characteristic properties of the reinforcing steel with a gauge length of 350 mm following the Chinese Code (GB 228.1-2010) [CMC, 2010b] were experimentally measured and summarized in Table 3.
TABLE 2: Compressive strength of concrete
|
Location |
Foundation |
Tie beam |
1st story |
2nd story |
3rd story |
|
fcu, 150mm (MPa) |
36.6 |
31.8 |
36.2 |
34.7 |
33.6 |
*fcu, 150mm is the compressive strength of concrete cubes with a size of 150 mm.
TABLE 3: Properties of reinforcing steel
|
Diameter (mm) |
fy (MPa) |
fu (MPa) |
Fracture strain (%) |
|
10 |
481 |
745 |
23.6 |
|
8 |
582 |
855 |
28.8 |
|
6 |
441 |
529 |
34.2 |
|
4 |
390 |
414 |
26.7 |
*fy and fu are the yield and ultimate strengths of the reinforcing bars, respectively.
(a)
(b)
(c)
FIGURE 1: Dimensions and reinforcement details of the scaled frame: (a) frame, (b) beams/columns and (c) joints.
|
|
|
|
(a) |
(b) |
|
|
|
|
(c) |
|

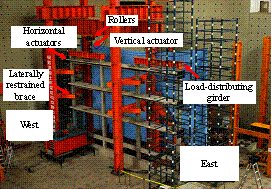
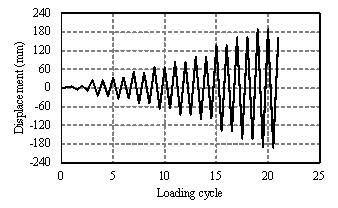
FIGURE 2: Test setup of the overall frame: (a) load pattern of the experiment, (b) experimental setup of the overall frame and (c) lateral loading protocol
2.2. Design of Half-Scale Key Components
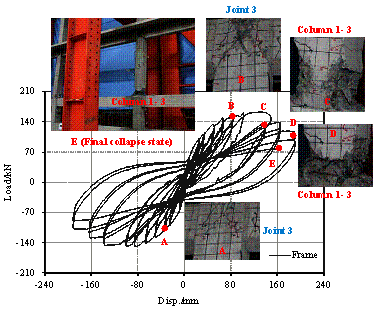
Damage modes observed in the Wenchuan earthquake and the preliminary numerical analysis [Tang, 2011] prior to the proposed tests have both revealed two notable characteristics: (1) the bottom of the columns on the first story exhibited severe damage, which may trigger the collapse of the overall structure; (2) the beam-column joints on the first story also experienced severe damage, which may affect the seismic performance of the overall structure. In consequence, to investigate the inherent correlation between the nonlinear behavior of these key structural components and the collapse mechanism of the overall structure, four frame columns and two beam-column joints on the first story are selected for the key component tests. These six specimens include two identical side columns, two identical middle columns, one side joint and one middle joint, as indicated in Figure 3. Note that the detailed design information of these components is identical to the corresponding components in the overall frame. Furthermore, based on the actual compressive strengths, the vertical loads applied to the key components are adjusted to ensure that the axial load ratios are consistent with those of the corresponding components in the overall structural test (see Table 4).
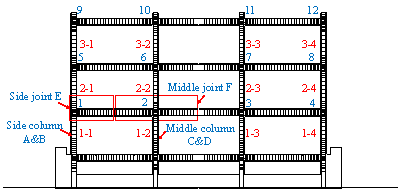
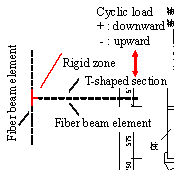
FIGURE 3: Locations of the selected key components
TABLE 4: Compressive strengths of concrete and axial forces for each specimen
|
Specimen |
fcu, 150mm (MPa) |
Axial load (kN) |
|
Side column A |
31.1 |
141 |
|
Side column B |
34.5 |
156 |
|
Middle column C |
30.1 |
256 |
|
Middle column D |
32.5 |
276 |
|
Side joint E |
43.4 |
218 |
|
Middle joint F |
41.6 |
398 |
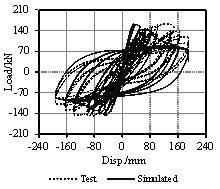
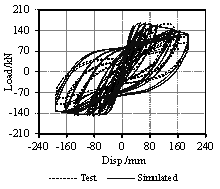
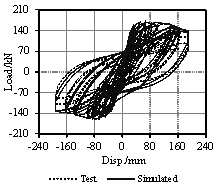
With regard to the collapse performance assessment for RC frames, Haselton et al. [2009] recommended that the components should be tested until the large deformation stage so that their near-collapse responses can be clearly observed. In view of this, the proposed test should be beneficial for (1) further understanding of the inherent collapse mechanisms of RC frames, and (2) more accurate calibrations of the numerical component models. As such, in this work, the columns are designed to be continuously loaded when the bearing capacity drops to 85% of the peak force, and the tests are not terminated until the columns completely lose their vertical load carrying capacity (i.e., the near-collapse state).
Note that the assumption of the constant vertical load may simplify the loading condition, although it may not fully represent the columns in the actual frame. Given that the constant loading condition has been proven to be capable of representing the characteristic behavior of RC components [Maruyama et al., 1984; Bousias et al., 1995; Qiu et al., 2002; Elsouri and Harajli, 2013], such a loading condition is therefore adopted to conduct the proposed tests of key components, and the constant load as given in Table 4 is applied at the top of the columns by an axial hydraulic actuator.
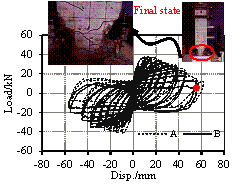
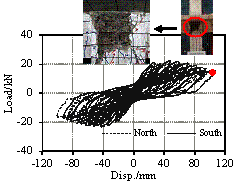
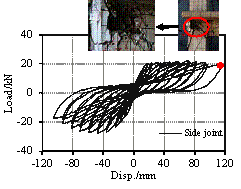
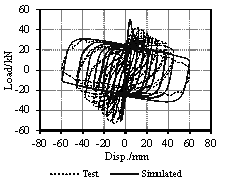
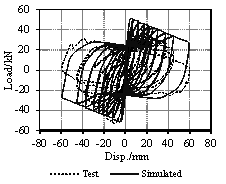
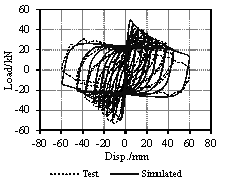
The test setup and the lateral loading protocols of the columns and joints are presented in Figure 4 and Figure 5, respectively. The constant vertical loads applied to the side joint and middle joint are 218 kN and 398 kN, respectively (Table 4). The seismic forces are simulated by gradually incremental loads or displacements at the beam ends. In this work, a slow loading velocity with a maximum value of 0.2 mm/s (i.e., nearly 15 minutes per cycle) is adopted to conduct the quasi-static tests. For such a slow loading velocity, the loading-rate effect can be negligible [Ghannoum et al. 2012].
|
|
|
|
(a) |
(b) |
|
|
|
|
(c) |
(d) |
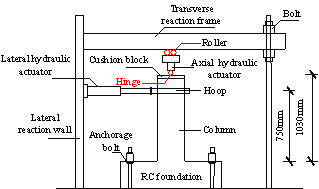

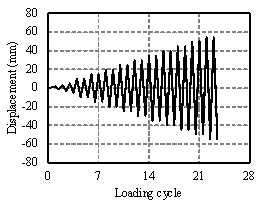
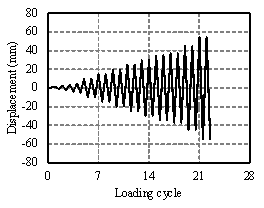
FIGURE 4: Test setup of the columns: (a) diagram of the experimental device, (b) photograph of the experimental device, (c) lateral loading protocol of side columns and (d) lateral loading protocol of middle columns
|
|
|
|
(a) |
(b) |
|
|
|
|
(c) |
(d) |
|
|
|
|
(e) |
(f) |
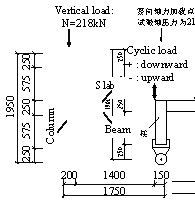
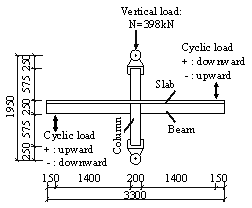
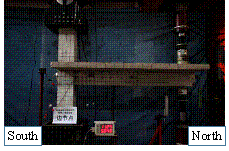
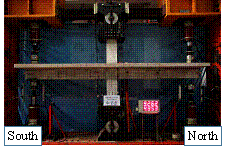

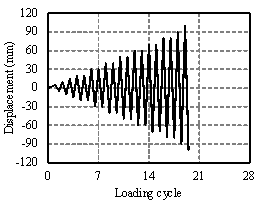
FIGURE 5: Test setup of the joints (mm): (a) diagram of the experimental device of Side joint E, (b) diagram of the experimental device of Middle joint F, (c) photograph of the experimental device of Side joint E, (d) photograph of the experimental device of Middle joint F, (e) vertical loading protocol of Side joint E and (f) vertical loading protocol of Middle joint F