Lessons from the collapse of typical RC frames in Xuankou School during the Great Wenchuan Earthquake

Xin-Zheng LU, Lie-Ping YE, Yu-Hu MA, Dai-Yuan TANG

(Department of Civil Engineering, Key Laboratory of Civil Engineering Safety and Durability of China Education Ministry, Tsinghua University, Beijing, China, 100084)

Advances in Structural Engineering, 2012, 15(1): 139-153.

Download Full Text

Abstract: The seismic damage of typical reinforced concrete (RC) frames in Xuankou School during the Great Wenchuan Earthquake in China is introduced. A simulation method for the seismic damage sustained was developed to enable analysis of the damage mechanisms. The simulation makes use of different nonlinear finite element (FE) models, including macro-scale fibre-beam-element models and a micro-macro-scale hybrid model. The results of the nonlinear FE simulations show that the design of RC frames do not properly allow for the influence of slabs and footing rotations, which results in incorrect predictions of the internal forces and hence, the seismic damage. The collapse resistances of different buildings are compared using incremental dynamic analysis (IDA). The IDA results show that the collapse resistance of the classroom buildings is much lower than that of the office buildings because the larger axial load ratio in classroom buildings limits their lateral deformation capacity. An optimum design is proposed which would improve the collapse resistances of classroom buildings at very low cost.

Keywords: collapse; seismic damage; Wenchuan Earthquake; RC frames; nonlinear finite element analysis

DOI: 10.1260/1369-4332.15.1.139

If you need the PDF version of this paper, please email to luxinzheng@sina.com

1 Introduction

On May 12, 2008 at 14:28 Beijing Time, the catastrophic Wenchuan earthquake, with a magnitude of 8.0, struck the north-western Sichuan Province of China. The epicentre was located at Yingxiu Town (31.0ˇăN, 103.4ˇăE) in Wenchuan County at a depth of approximately 14 kilometres (Wang, 2008).

The Great Wenchuan Earthquake was the most devastating in China in the past three decades. At least 69,195 people were killed, 374,177 injured and 18,392 missing and presumed dead. At least 15 million people were evacuated from their homes, and more than 5 million left homeless. The total area of collapsed buildings was over 150 million square metres, and the total economic loss over 120 billion US dollars (Wang, 2008).

Despite the large number of buildings that collapsed, many avoided collapse, even though they were located in the hardest-hit region. It will be very beneficial to China and other similar developing countries to investigate why some buildings collapsed and some survived, and to develop efficient engineering measures that will improve the collapse resistance of buildings during an earthquake.

The buildings of Xuankou School, located near the epicentre of the earthquake, were chosen for an analysis of seismic damage mechanisms and collapse resistances. The analysis is described in this paper and suggestions are proposed to improve future computational models and seismic design.

2 Seismic Damage in Xuankou School

Xuankou School was located in Yingxiu Town at the epicentre of the Wenchuan Earthquake. There were ten reinforced concrete (RC) frame buildings, including three classroom buildings, one office building, five residential or dormitory buildings, and one dining building. All the buildings were designed following the latest Chinese Seismic Design Code (GB, 2001) and were built in 2007. According to the Chinese Seismic Design Code (GB, 2001), these buildings had a seismic fortification intensity of VII, with a maximal considered earthquake (MCE) peak ground acceleration (PGA) of 220 cm/s2 (corresponding to Sa,max=0.50g, where Sa,max is the maximal spectral acceleration). However, because Xuankou School was very close to the epicentre, the actual ground motion intensity was approximately XI with a corresponding PGA ³ 1.0 g. The large difference between the design intensity and the actual intensity caused severe damage. Three of the ten RC frames totally collapsed, two partially collapsed, and the other five suffered various levels of damage (Figure 1).

The buildings had the same design, construction and site conditions, but fairly different degrees of seismic damage. Most of the RC frames with larger spans, such as the classroom buildings, suffered serious seismic damage or collapsed, whereas most of the RC frames with smaller spans, such as those for the office building and the residential buildings, had slight damage and did not collapse. In addition, the failure modes and positions of plastic hinges of the collapsed frames were different from those assumed in conventional design. Therefore, this work uses the collapsed Classroom Building A and the surviving Office Building H (Figure 1) as examples for introducing the seismic damage suffered and for analysing corresponding damage mechanisms.

2.1 Classroom Building A

2.1.1 General information

Classroom Building A was a six-storey (partially five-storey) cast-in-site RC frame, with a total floor area of 3618.3m2. The layout of the building is shown in Figure 2. The height of each storey was 3.6 m. The rectangular section of the columns was 400 mmˇă400 mm. The thickness of all infill walls was 200 mm. The foundation of the building consisted of single footings at the feet of the columns. The design concrete strength of the beams, columns and slabs was C30, with a uniaxial compressive strength of 20.1 N/mm2. The steel reinforcement was HRB335 rebar, with a yield strength of 335 N/mm2. The infill wall was constructed with MU10 hollow masonry and M5 cement mortar.

2.1.2 Seismic Damage

(1)   The entire building totally collapsed toward the south (Figure 3). The other two classroom buildings (B and C in Figure 1) also collapsed (Figure 4), both with structures similar to that of Classroom Building A.

(2)   The failure modes of the classroom buildings consisted of bottom storey collapsing to the corridor side with other storeys collapsing towards the classroom side, as shown in Figure 5.

(3)   A large number of plastic hinges formed in the RC frames (Figure 3b-d). The damage in the columns was much more severe than that in the beams. The damage at the tops of the bottom storey columns was more severe than that at the feet of the columns (Figure 3b and c).

2.2 Office Building H

2.2.1 General information

Office Building H of Xuankou School was a four-storey (partially three-storey) cast-in-situ RC frame, with a total floor area of 1180.4m2. The layout of the building is shown in Figure 6. The height of each storey was 3.6 m. The section of the columns was 400 mmˇă400 mm. The thickness of all infill walls was 200 mm. The foundation of the building comprised single footings at the feet of the columns. The design concrete strength of the beams, columns and slabs was C30. The steel reinforcement was HRB335 rebar. The infill wall was constructed with MU10 hollow masonry and M5 cement mortar.

2.2.2 Seismic Damage

Office Building H survived the earthquake and seismic damage was relatively limited. The frames at the bottom storey were slightly damaged (Figure 7a). Other detailed damage included:

(1)   Local damage at the top storeys of Office Building H due to collision with the adjacent classroom building, as shown in Figure 7b.

(2)   A large number of cracks in the infill walls.

2.3 Analysis of Seismic Damage

Based on the damage described above, the following problems are evident:

(1)   Although Xuankou School was located near the epicentre and the seismic intensity was much greater than the maximal considered earthquake (MCE) during design, some of its buildings successfully avoided collapse. This shows that appropriate design can prevent buildings from collapse in Mega-Earthquakes (i.e., earthquakes larger than the MCE). This will benefit developing countries whose seismic fortification measures are limited for economic reasons.

(2)   There were different degrees of seismic damage between the classroom buildings and Office Building H even though they were constructed on the same site and in the same year, and were designed following the same design code. As stated above, seismic damage of the classroom buildings was much more severe than that of Office Building H. Even though the earthquake occurred when the classroom buildings were full of people and the gravity load was therefore larger than that of Office Building H (the weight of people in the classroom buildings was approximately 15% of the total gravity load), the current design methods should still be investigated further.

(3)   The damage in the columns was much more severe than the damage in the beams. Even though the ˇăstrong column-weak beamˇ± principle is required in the Chinese Seismic Design Code (GB, 2001), the actual seismic damage obviously did not conform to the failure mode specified in the design code.

(4)   For most columns in the bottom storey, the damage was more severe at the top of a column than at the bottom. According to the statistics for the 86 RC frames damaged in the Wenchuan Earthquake (Tian et al. 2009), the number of columns which failed at the top was approximately double the number which failed at the bottom. Even though some failures at the feet of columns were difficult to discover because they were buried in the soil, to have more failures at the tops of columns was contrary to the expectations of conventional seismic design.

3 Computational models and seismic damage simulation

In order to understand the seismic damage mentioned above, nonlinear finite element (FE) analysis was implemented to simulate the seismic damage of Classroom Building A and Office Building H.

An accurate computational model that can represent the actual mechanical properties of the structures is critical for revealing the seismic damage mechanism. For structural elements in RC frames whose strengths and ductility are strongly controlled by the axial force-bending moment interaction, the fibre-beam-element model is widely accepted as suitable for proper simulation (Lai et al. 1984; Spacone et al. 1996; Taucer et al. 1991; Ye et al. 2006). However, fibre-beam-element models are ˇămacro-scaleˇ± models (also referred to as ˇădiscrete finite element (member) modelsˇ± by Spacone et al. (1996)), which have some difficulties in simulating ˇămicro-scaleˇ± failures such as the failures inside footings and joints. In addition, a trial simulation using the fibre-beam-element model, which is in accordance with the conventional design computational model in China, results in significantly different damage characteristics to those of the actual seismic damage (to be introduced in detail in Section 3.1.4).

Therefore, a micro-macro-scale hybrid model was proposed to provide a better approach to the simulation of seismic damage. The macro-scale fibre-beam-element model was then improved to simulate the actual behaviour of the structures based on the results of the micro-macro-scale hybrid model. Finally, a large number of statistical analyses (incremental dynamic analysis (IDA) (Vamvatsikos & Cornell, 2002) based on 23 ground motions) were undertaken with the improved fibre-beam-element model. Collapse fragility curves were calculated to explain the differences in collapse resistance between the office building and the classroom buildings and to propose a corresponding optimized design.

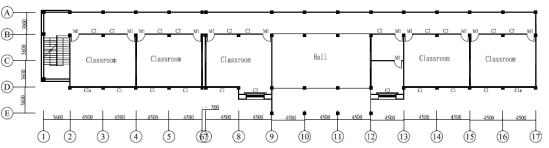
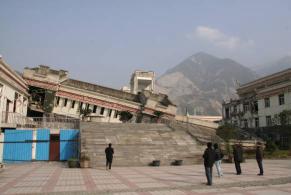
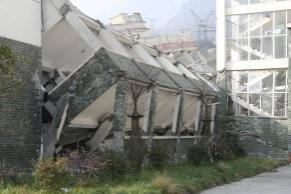
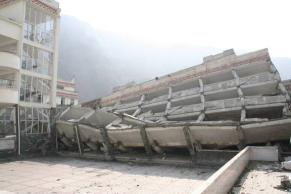
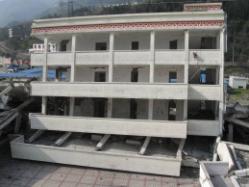
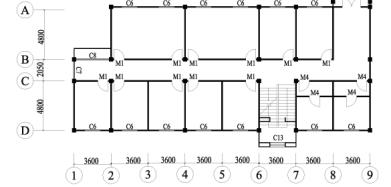
According to the on-site investigation, every classroom building collapsed along its short axis (Figures 3 and 4). Therefore, to simplify the simulation and highlight the most important factors, two-dimensional nonlinear FE models were created for Classroom Building A on its short axis (i.e., the actual collapse direction). For convenience, a two-dimensional nonlinear FE model was also created for Office Building H on its short axis to compare with Classroom Building A.

Several computational models were used in the following discussion of seismic damage simulation. To avoid confusion, these models are briefly summarized in Table 1. Further details are described in sections below.

3.1 Fibre-beam-element model

The fibre-beam-element model has been widely used to model RC frames whose failures are controlled by flexural behaviours (Lai et al. 1984; Spacone et al. 1996; Taucer et al. 1991; Ye et al. 2006). In the fibre-beam-element model, the frame elements (beams and columns) are modelled with beam elements, and the sections of the beam elements are divided into individual fibres. Each fibre follows a uniaxial constitutive law, and different fibres in the same section follow the assumption that ˇăplane section remains planeˇ±. The fibre-beam-element model can simulate the axial-flexural coupling of RC frames, and is easily adapted to different section shapes.

3.1.1 Constitutive law of concrete

The stress-strain model proposed by L¨¦geron & Paultre (2005) was used in this work to model the backbone curve of concrete, a model which can represent the confinement of concrete due to stirrups (Figure 8a). Parabolic curves proposed by Mander et al. (1998) were adopted to model the concrete unloading and reloading paths. This model can take account of the degradation of concrete strength and stiffness due to cyclic loading (Figure 8b). An exponential model proposed by Jiang et al. (2005) was used to model the softening branch of cracked concrete, a model which also allows the ˇătension-stiffening effectˇ± of reinforced concrete can be taken into account (Figure 8b).

3.1.2 Constitutive law of steel

The stress-strain model proposed by Esmaeily & Xiao (2005) was adopted to model the backbone curve of steel (Figure 9a). The model proposed by L¨¦geron et al. (2005) was adopted to model the unloading and reloading paths, and also the Bauschinger effect of steel (Figure 9b).

3.1.3 THUFIBER program

Based on the above material models, a fibre-beam-element based program referred to as THUFIBER (Ye et al. 2006; Lu et al. 2008a,b; Miao et al. 2007) was developed by the authors, which can be embedded into the general purpose FE software MSC.MARC using the user subroutine UBEAM (MSC, 2005). Examples and benchmarks (Ye et al. 2006; Lu et al. 2008a,b; Miao et al. 2007) show that this program can precisely simulate the nonlinear behaviours of RC frames.

3.1.4 Problems in conventional design computational models

According to the conventional design computational models for RC frames in China, the column feet in the bottom storey are fixed to the foundation (i.e., no rotation of the footings), and only frame beams and columns are included in the computational model. The contribution of the floor slabs to the strength of the beams is not considered. The reinforcement of the RC frame is designed to resist internal forces obtained from this computational model. To ensure that the ˇăstrong column-weak beamˇ± failure mode occurs, the Chinese Seismic Design Code (GB, 2001) requires:

SMc>hc SMb                                                         (1)

where SMc is the total design bending moment in the columns connected to a joint, SMb is the total design bending moment in the beams connected to the same joint, and hc is a moment amplification factor. For RC frames in Xuankou School, hc =1.1 (GB, 2001).

A fibre-beam-element model (referred as Macro-model A in Table 1) was built in accordance with the above conventional design computational model (i.e. floor slabs not considered and columns fixed to the foundation). According to the orientation of Classroom Building A, the north-south (NS) and the vertical (UD) components of the Shifang-Bajiao ground motion record, which were obtained near the epicentre during the Great Wenchuan Earthquake, were used as input to Macro-model A. The peak ground acceleration of the ground motion was scaled to 1.0g to match the actual intensity at Xuankou School.

The failure mode predicted by Macro-model A subjected to the Wenchuan NS+UD ground motions is shown in Figure 10, and clearly differs from the actual failure mode in the following respects: (1) most plastic hinges occur in the beams rather than in columns; (2) the damage at the feet of columns in the bottom storey is more severe than at the top of the columns. The collapse starts from a compression-bending failure at the foot of the middle-column in the bottom storey.

Thus, Macro-model A is not consistent with the actual behaviour of the structure. Further discussions were therefore needed concerning the computational models appropriate for these structures.

3.1.5 Fibre-beam-element model allowing for the influence of slabs

Most of the plastic hinges predicted by Macro-model A are located in the beams, which is significantly different from the actual seismic damage. Through a preliminary analysis, the possible reason for this difference is that Macro-model A, as well as Eqn. (1) in the Chinese Seismic Design Code (GB, 2001), do not consider the strengthening effect of the floor slabs on the frame beams. Actually, cast-in-situ RC slabs can work together with the beams, significantly increasing the stiffness and strength of the beams. Thus, a ˇăstrong beams-weak columnsˇ± failure mode may appear in cast-in-situ RC frames such as Classroom Building A.

Therefore, to take into account the influence of slabs, Macro-model A was improved. The frame beams were modelled as T-shaped beams in the fibre-beam-element model. The flange of the T-beam represents the floor slab. The thickness of the flange is equal to the thickness of the slab, and the width of the flange on each side (i.e., the width of the slab considered in the computation) is 6 times the thickness of the slab (ACI 2005, Leon 1984). The flange has the same reinforcement as the slab. This macro-scale fibre-beam-element model, which considers the slabs, is referred to as Macro-model B in Table 1. The NS+UD components of the Wenchuan Earthquake ground motion mentioned in Section 3.1.4 were now used as input to Macro-model B and the predicted failure mode is shown in Figure 11.

A comparison between Figures 10 and 11 reveals that when the influence of slabs is considered, the damage in columns is more severe than the damage in beams. This failure mode is closer to the actual seismic damage. However, although the actual collapse began from the tops of bottom storey columns, the predicted collapse begins from the feet of columns in the bottom storey. Consequently, a more detailed analysis is still needed for the bottom storey of the building.

3.2 Micro-macro-scale hybrid model

Both Macro-model A and Macro-model B predict damage to be more severe at the feet of columns in the bottom storey than at their tops. This differs from the actual seismic damage. A preliminary analysis revealed that a possible reason for this difference is that in both Macro-model A and Macro-model B, the column feet are fixed to the foundation, even though the actual rotational stiffness of single footings of this type cannot be infinite.

Therefore, a micro-macro-scale hybrid model (referred as Hybrid-model in Table 1) was proposed to give a more detailed simulation of the bottom storey frame and the footings (Figure 12), and also to balance accuracy with computational workload.

In the micro-macro-scale hybrid model, the critical parts that may control the collapse of the frame, such as the beams, the columns, the slabs in the bottom storey, the footings and the soil, are modelled with micro-scale continuum elements, while the remaining parts are still modelled with the same fibre-beam-elements as those in Macro-model B.

In the micro-scale part, concrete is modelled with 3-dimensional solid elements. The compressive and tensile behaviour of concrete is modelled using the elasto-plastic constitutive law and the smeared crack model, respectively, which are provided by MSC.MARC (MSC 2005, Lu et al. 2005). The equivalent uniaxial stress-strain relationship of concrete is the same as the backbone curve shown in Figure 8a. The longitudinal reinforcements and stirrups are modelled with truss elements whose stress-strain relationships are the same as the one shown in Figure 9. The ˇăINSERTˇ± function provided by MSC.MARC software (MSC, 2005) is used to maintain the displacement compatibility between the rebar and the concrete elements. Also, the width of the floor slabs in the micro-scale part is equal to 6 times the thickness of the slabs. The width of the foundation soil is 5 times the width of the footing. The interaction between the footings and soil is simulated with a contact algorithm, which can transfer pressure through the interface and open when there is tensile force at the interface (MSC, 2005).

3.2.1 Interface between the micro-scale part and the macro-scale part

The interfacial model proposed by Lu et al. (2008c) was adopted to maintain deformation compatibility between the solid elements in the micro-scale part and the beam elements in the macro-scale part. To build up the interface, three useful functions provided by MSC.MARC were used (user defined nodal coordinates, RBE2 nodal ties and UFORM user subroutine (MSC, 2005). This interfacial model can avoid unnecessary stress concentrations. The details of this interfacial connection method are introduced in Appendix A of this paper.

3.2.2 Simulation results of micro-macro-scale hybrid model

The NS+UD components of the Wenchuan Earthquake ground motion mentioned in Section 3.1.4 were used as input to the Hybrid-model, and the time-history curve of the roof displacement is shown in Figure 13. The plastic zone in the bottom storey before and during the collapse process is shown in Figure 14. It can be seen that the columns have more plastic zones than the beams, and collapse begins from the top of the middle-column in the bottom storey. The results of the Hybrid-model, therefore are consistent with the actual seismic damage.

There are obvious footing rotations in Figure 14, which will reduce the bending moment reactions at the column feet. Consequently, there are more plastic zones at the tops of columns in the bottom storey, and the collapse starts from the top of the middle-column in the bottom storey.

3.3 Fibre-beam-element model considering the influence of slabs and footing rotations

The micro-macro-scale hybrid model provides a powerful tool for explaining and analyzing the damage mechanism of Classroom Building A. However, the relatively large computational workload of the Hybrid-model makes it difficult to use for collapse fragility analysis, for which a large number of statistical dynamic analyses are required. By contrast, both the modelling and computing of the macro-scale fibre-beam-element model are much easier. With proper parameters and boundary conditions, fibre-beam-element models may also be able to accurately simulate the collapse processes of frames. Hence, the macro-scale fibre-beam-element model (Macro-model B) was further improved by supplementation with detailed structural information obtained from the Hybrid-model. The improved fibre-beam-element model is able to simulate the rotations of the footings, and yet maintain its simplicity in modelling and computing.

Therefore, based on the results of the Hybrid-model, to allow for the rotations of the footings, rotational springs were added to the column feet of Macro-model B. This new model is referred to as Macro-model C in Table 1. The stiffness of the rotational springs was determined from a pushover analysis of the Hybrid-model, and found to be approximately 7000 kNm/rad. Because the factors that may influence the stiffness of the footing rotations are very complicated, the value of rotational stiffness is specifically discussed below.

The NS+UD components of the Wenchuan Earthquake ground motion mentioned in Section 3.1.4 were used as input to Macro-model C. The time-history curve of the roof displacement and the failure mode are shown in Figures 13 and 15. From the curve comparison in Figure 13 and failure mode comparison between Figure 14 and 15, it can be seen that the results of Macro-model C and the Hybrid-model are in agreement with respect to: displacement responses, plastic hinge positions, and the points where collapse starts.

From Figure 15, it can be seen that collapse starts from the middle-column in the bottom storey. When the collapse starts, the deformation direction of the bottom storey inclines to the right side (i.e., to the corridor side) (Figure 15a). Due to the combined bending moment and axial force, the head of the middle-column in the bottom storey crushes first (Figure 15b). After the failure of the middle-column, the axial force in the left side-column (i.e., on the classroom side) suddenly increases, followed by crushing at the top of the left side-column (Figure 15c). At this moment, the collapse direction of the bottom storey still inclines to the right (i.e., to the corridor side), as the arrow at the bottom of Figure 15c indicates. It is interesting to note that because the gravity load on the corridor is relatively small, the failure of the corridor side-columns is delayed relative to the other columns. After failure of the two columns in the bottom storey which support the classroom, the upper storeys incline to the left (i.e., the classroom side), as the arrow at the top of Figure 15c indicates. This simulated failure mode is very close to actual observations (Figures 3, 4 and 5). In summary, the collapse of Classroom Building A can be properly simulated with Macro-model C. Furthermore, the computational workload of Macro-model C is much smaller than that for the Hybrid-model. Hence, Macro-model C could be further used to predict the collapse fragility curve, requiring a prodigious number of nonlinear time-history computations.

Because the factors that may influence the stiffness of the footing rotations are very complicated, the estimated rotational stiffness of 7000 kNm/rad, which is determined from the Hybrid-model, may not precisely agree with the actual rotational stiffness. To account for this, the rotational stiffness was adjusted by ˇŔ30%, which yielded a range from 4900 kNm/rad to 9100 kNm/rad, in order to assess the sensitivity to assumed rotational stiffness of the footings. The failure modes with different rotational stiffnesses are shown in Figure 16. Comparing Figures 15 and 16, it can be seen that with smaller rotational stiffnesses, the plastic hinges are concentrated more in the bottom storey; whereas with greater rotational stiffness, more plastic hinges appear in the second storey. Generally, however, the failure modes in Figures 15 and 16 display no important differences. All the failures start from the top of the middle-column in the bottom storey, and the plastic hinges in the columns are more severe than those in the beams, in agreement with the actual seismic damage. So it can be concluded that although the footing rotational stiffness from the Hybrid-model may not be absolutely accurate, its value does not seriously influence the collapse simulation. The footing rotational stiffness of 7000 kNm/rad was used in later collapse fragility assessments.

The failure modes shown in Figures 15 and 16 are obviously different from that shown in Figure 11 (the fixed column feet in Macro-model B means that the rotational stiffness of the footings is infinite). Consequently, in buildings such as Xuankou School with single footings, rotation of the footings should not be ignored. The wide use of fixed constraints assumption for the column feet, that is used in the design computational models of RC frames may overestimate the restraint capacity of the footings, which will result in incorrect predictions of internal force and deformation.

From the above analysis, it can be concluded that because of inappropriate modelling of the slabs and footing rotations in the conventional design computational models used in China, actual seismic damage is quite different from that assumed (Figure 10). Therefore, the computational model used should be more carefully verified in future seismic designs.

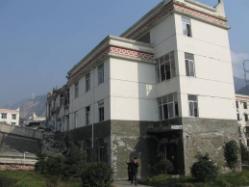
Because Office Building H did not collapse in the earthquake, and its seismic damage was relatively slight, only a macro-scale fibre-beam-element model considering the influence of slabs and footing rotation (i.e., Macro-model D in Table 1) was built to predict seismic response. The EW+UD components of the Wenchuan Earthquake ground motion mentioned in Section 3.1.4 were used as input to Macro-model D according to the orientation of the building. The deformation and the plastic hinge distributions are shown in Figure 17. From Figure 17 it can be seen that the building avoids collapse in the earthquake. The predicted plastic hinges of Office Building H are mostly located in the bottom storeys, and are relatively slight. This prediction is in agreement with the actual seismic damage.

When the NS+UD components of the Wenchuan Earthquake ground motion (which were used to predict the collapse of the classroom buildings) are used as input to Office Building H, Office Building H remains able to avoid collapse. The corresponding deformation and plastic hinge distributions in Office Building H are shown in Figure 18. There are more plastic hinges in Figure 18 than in Figure 17. Consequently, the NS+UD components of the Wenchuan Earthquake ground motion have a higher damage capacity than the EW+UD components.

A comparison between the failure modes of Classroom Building A (Figures 14 and 15) and Office Building H (Figures 17 and 18) shows that there are two disadvantages in the design of Classroom Building A:

(1)   The structure of Classroom Building A has obvious weak points. The axial load ratios (the ratio between axial load and axial resistance) of the columns in the bottom storey, particularly for the middle-column in the bottom storey, are relatively large, resulting in a low lateral deformation capacity. This is why failure always starts from the middle-column, and the progressive collapse of the entire structure follows.

(2)   Apart from the frame in the bottom storey, most structural elements above the second storey have no plastic deformations at the moment when Classroom Building A begins to collapse. Consequently, the energy dissipation capacities of these structural elements do not effectively develop. By contrast, Office Building H has more plastic hinges than Classroom Building A, and the plastic hinges in Office Building H are more evenly distributed. Thus, the global energy dissipation capacity of Office Building H is more effectively developed.

4 Collapse resistance analysis based on IDA

The damage mechanisms and the collapse resistance of different frames have been primarily discussed, based on comparison of the failure modes of Classroom Building A and Office Building H subjected to Wenchuan Earthquake ground motions. However, because of the random and complicated nature of earthquakes, a single ground motion record cannot reveal all problems in the design. Therefore, based on Macro-model C and Macro-model D, an incremental dynamic analysis (IDA) (Vamvatsikos & Cornell 2002) was implemented with a number of input ground motions to give a more accurate analysis of differences in collapse resistance. Twenty-three seismic ground motions were adopted for the IDA. Among them, 22 ground motions were from the far-field record set proposed in the ATC-63 reports (ATC, 2009) together with the El-Centro 1940 record (Chopra, 2000), which is widely used in earthquake engineering. The ground motion record set proposed by ATC-63 has been carefully selected to give a rational representation of the random nature of strong earthquakes.

The failure modes of Classroom Building A and Office Building H subjected to different intensities and different ground motions were predicted using Macro-model C and Macro-model D. The typical failure mode of Classroom Building A in following IDA is found to be similar to the actual failure mode following the Wenchuan Earthquake (Figure 15). The typical failure mode of Office Building H is shown in Figure 19, in which the collapse is due to soft-storey failure in the bottom storey.

The collapse fragility (or collapse possibility) curves of the two frames subjected to different ground motion intensities are shown in Figure 20, in which the x-axis is the normalized ground motion intensity, Sa(T1)/Sa(T1),MCE. Sa(T1) is the spectral acceleration of ground motion at the fundamental period T1 (ATC, 2009). Sa(T1),MCE is the design spectral acceleration at the fundamental period T1 for the maximal considered earthquake (MCE) (ATC, 2009). According to the Chinese Seismic Design Code (GB, 2001), for Classroom Building A, Sa(T1),MCE =0.16 g, whereas for Office Building H, Sa(T1),MCE =0.27 g.

From the comparison in Figure 20 it can be seen that in Mega-earthquakes such as the Great Wenchuan Earthquake, whose intensity was approximately 4 times the MCE intensity (Sa(T1)/Sa(T1),MCEˇÖ4), the collapse possibility for Office Building H is less than 20%, whereas the collapse possibility for Classroom Building A exceeds 80%. Thus, despite differences in orientation and ground motion, the internal collapse resistance of a building plays a major role in determining its ultimate fate.

From Figure 20 it can be concluded that there are problems in the Chinese Seismic Design Code with respect to the collapse resistance of buildings against Mega-earthquakes. Even though the office building and the classroom buildings designs were based on the same design code, their collapse resistance differed significantly. For developing countries such as China, the MCE intensity in the corresponding seismic design code is generally insufficient because of technological and economic limitations. Thus, it is very important to pay more attention to the collapse resistance of buildings in Mega-earthquakes larger than the MCE.

5 Optimized design suggestions

From comparison of the failure modes of Classroom Building A and Office Building H, it can be seen that the collapse of Classroom Building A always begins as a result of compression-bending failure of the middle-column in the bottom storey. The plastic deformation capacity and energy dissipation capacity of structural elements in the upper storeys are not fully developed. By contrast, the deformation capacities and energy dissipation capacities of Office Building H are much better utilized. This significant difference is caused by the large axial load ratio of the middle-column in the bottom storey of Classroom Building A. This is the fatal weak point that limits the deformation capacity of the entire structure. In consideration of this, if the axial load ratio could be reduced by increasing the sizes of the columns, the collapse resistance of the building could be effectively improved. For example, according to the failure mode in Figure 15, Classroom Building A would be strengthened by increasing the column sections in the bottom two storeys from 400ˇă400 mm to 500ˇă500 mm. The other parameters are the same as those used in Macro-model C. The strengthened Classroom Building A is referred as Macro-model E in Table 1. The collapse fragility curve of Macro-model E following an IDA is shown in Figure 20. From this, it can be seen that the collapse resistance of Classroom Building A is significantly improved, and is roughly equal to that of Office Building H. Furthermore, the cost of such strengthening is very small. Figure 21 shows the predicted deformation and plastic hinges when the NS+UD components of the Wenchuan Earthquake ground motion mentioned in Section 3.1.4 are used as input to Macro-model E. It can be seen that the strengthened classroom building successfully avoids collapsing under the Wenchuan Earthquake ground motion. In addition, by comparing Figure 15 and Figure 21, it can be seen that there are more plastic hinges in the strengthened structure and the plastic hinges are also more evenly distributed. Thus, the energy dissipation capacity and the collapse resistance of the structure were significantly improved.

From the above analyses, it can be concluded that by building up numerical models that can properly simulate seismic damage, and by analyzing the mechanisms of failure, the weak points of a design can be deduced. Then, by strengthening the structure at these weak points, collapse resistance can be effectively improved at very low cost.

6 Conclusions

The seismic damage in typical RC frames of the Xuankou School during the Great Wenchuan Earthquake has been presented above. Numerical models that can properly simulate this seismic damage were proposed, and the collapse fragility of the RC frames analyzed. The following conclusions can be drawn.

(1)   For RC frames designed according to the current Chinese Seismic Design Code, RC frames with larger spans (such as classroom buildings) have a lower collapse resistance than RC frames with smaller spans (such as the office buildings). The larger axial load ratios in RC frames with larger spans limit their lateral deformation capacity. So further specifications should be provided to improve the deformation capacity of RC frames with larger spans.

(2)   An accurate computational model is critical for seismic design and seismic damage prediction. The conventional design computational models for RC frames in China do not properly allow for the influences of slabs and footings rotation, which results in incorrect predictions of the internal forces and hence the seismic damage. Ignoring the strengthening effect of slabs on beams may result in a ˇăstrong beams-weak columnsˇ± failure mode. Ignoring footing rotation may result in more failures at the tops of columns.

(3)   With the appropriate parameters and boundary conditions, macro-scale fibre-beam-element models can accurately simulate seismic damage, and their modelling, computational workload and nonlinear solving difficulties are much smaller than those of micro-macro-scale hybrid models.

(4)   For special failures that may need more detailed simulation, the proposed micro-macro-scale hybrid model is a useful tool for analyzing micro-scale behaviour, and for determining parameters that can be used to improve macro-scale models.

(5)   By analyzing its mechanisms of failure, the weak points of a design can be discovered, and by strengthening a structure at these weak points, its collapse resistance can be effectively improved at very low cost.

Appendix A. Interface between the macro- and micro-scale parts

Lu et al. (2008c) proposed the following method to build up the interface and maintain deformation compatibility between the macro- and micro-scale parts.

(1)   Local coordinates are set up for the interfacial nodes between the micro- and macro-scale parts. The origin of the local coordinates is located at Node B of the macro-scale part (Figure A1). The local x-axis is always along the axial-axis of the beam element. The local y-axis and z-axis are parallel to the strong and weak axes of the beam element. All the displacements of the nodes in the interface (Nodes A1, A2...An in micro-scale part and Node B in macro-scale part) are defined in this local coordinate system. The deformation compatibility can thereby be ensured even when large displacements occur.

(2)   The compatibility of lateral displacements in the local coordinates (displacements in local y and z axes in Figure A1) are ensured with the user subroutine UFORM (user defined constraint conditions) of the general purpose FE software of MSC.MARC (MSC, 2005). Thus, the shear forces and the torsion moment can be evenly transformed between the micro- and macro-scale parts (Huang, 2009).

(3)    The compatibility of axial displacements between the micro-scale and macro-scale parts (displacements in local x axis in Figure A1) is ensured with the RBE2 nodal ties provided by MSC.MARC (MSC, 2005). REB2 nodal ties can ensure that the nodes deform is accordance with the assumption that ˇăplane sections remain plane.ˇ±

Acknowledgement

The authors are grateful for the financial support received from the National Science Foundation of China (No. 90815025, 51178249), the National Key Technologies R&D Program (No. 2009BAJ28B01), Tsinghua University Research Funds (No. 2010THZ02-1) and the Program for New Century Excellent Talents in University (NCET-10-0528).

References

ACI, (2005). Building code requirements for structural concrete (ACI 318-05), American Concrete Institute, Farmington Hills, Michigan.

ATC. (2009). Quantification of building seismic performance factors (ATC-63 Project Report). Applied Technology Council, Redwood City, CA.

Chopra A. K. (2000). Dynamics of structures: theory and applications to earthquake engineering, Prentice Hall, Upper Saddle River, New Jersey.

Esmaeily A. and Xiao Y. (2005), ˇăBehavior of Reinforced Concrete Columns under Variable Axial Loads: Analysisˇ±, ACI Structural Journal, Vol. 102, No. 5, pp. 736-744.

GB (2001). Code for seismic design of buildings (GB50011-2001), China Building Industry Press, Beijing, China.

Huang Y. L. (2009). Simulating the inelastic seismic behavior of steel braced frames including the effects of low-cycle fatigue, PhD Thesis, University of California, Berkeley, American.

Jiang J. J., Lu X. Z. and Ye L. P. (2005). Finite Element Analysis of Concrete Structures, Tsinghua Press, Beijing.

Lai S. S., Will G. T. and Otani S. (1984). ˇăModel for Inelastic Biaxial Bending of Concrete Membersˇ±, Journal of Structural Engineering, ASCE, Vol. 110, No. 11, pp. 2563-2584.

L¨¦geron F and Paultre P. (2005). ˇăUniaxial Confinement Model for Normal and High-Strength Concrete Columnsˇ±, Journal of Structural Engineering, ASCE, Vol. 129, No. 2, pp. 241-252.

L¨¦geron F., Paultre P. and Mazars J. (2005). ˇăDamage Mechanics Modeling of Nonlinear Seismic Behavior of Concrete Structuresˇ±, Journal of Structural Engineering, ASCE, Vol. 131, No. 6, pp. 946-954.

Leon R. T. (1984). ˇăThe Effect of Floor Member Size on the Behavior of Reinforced Concrete Beam-Column Jointsˇ±, Proceedings of 8th World Conference on Earthquake Engineering, San Francisco, Calif., July, pp.445-452.

Lu X. Z., Ye L. P., Teng J. G. and Jiang J. J. (2005). ˇăMeso-Scale Finite Element Model for FRP Sheets /Plates Bonded to Concreteˇ±, Engineering Structures, Vol. 27, No. 4, pp. 564-575.

Lu X. Z., Lin X. C., Ma Y. H., Li Y. and Ye L. P. (2008a). ˇăNumerical Simulation for the Progressive Collapse of Concrete Building due to Earthquakeˇ±, Proceedings of 14th World Conference on Earthquake Engineering, Beijing, China, October, CDROM.

Lu X.Z., Li Y., Ye L. P. and Liang Y. (2008b). ˇăApplication of Fiber Model for Progressive Collapse Analysis of Reinforced Concrete Framesˇ±, Proceedings of 12th Int. Conf. on Computing in Civil and Building Engineering, Beijing, China, October, CDROM.

Lu X. Z., Lin X. C. and Ye L. P. (2008c). ˇăMultiscale Finite Element Modeling and its Application in Structural Analysisˇ±, Journal of Huazhong University of Science and Technology (Urban Science Edition), Vol. 25, No. 4, pp. 76-80.

Mander J. B., Priestley M.J.N. and Park R. (1998). ˇăTheoretical Stress-Strain Model for Confined Concreteˇ±, Journal Structural Engineering, ASCE, Vol. 114, No. 8, pp. 1804-1825.

Miao Z. W., Lu X. Z., Ye L. P. and Ma Q. L. (2007). ˇăSimulation for the Collapse of RC Frame Tall Buildings under Earthquake Disasterˇ±, Proceedings of Int. Symp. on Computational Mechanics (ISCM2007), Beijing, China, July 30-August 1, CDROM.

MSC. (2005). MSC. MARC. UserˇŔs manual. MSC Software Corporation.

Spacone E., Filippou F. C. and Taucer F. F. (1996). ˇăFiber Beam-Column Modeling for Non-Linear Analysis of R/C Framesˇ±, Earthquake Engineering and Structural Dynamics, Vol. 25, No. 7, pp. 711-725.

Taucer F. F., Spacone E. and Filippou F. C. (1991). ˇăA Fiber Beam-Column Element for Seismic Response Analysis of Reinforced Concrete Structuresˇ±, Report No. UCB/EERC-91/17, UC Berkeley, American.

Tian Z.P., Zhang X. P. and Zhao T. (2009). ˇăSeismic Damage of Multistory Reinforced Concrete Frame Structures in Wenchuan Earthquakeˇ±. Report of Sichuan University, China.

Vamvatsikos D. and Cornell C. A. (2002). ˇăIncremental Dynamic Analysisˇ±, Earthquake Engineering and Structure Dynamics, Vol. 31, No. 3, pp. 491-514.

Wang Z. F. (2008). ˇăA Preliminary Report on the Great Wenchuan Earthquakeˇ±, Earthquake Engineering and Engineering Vibration, Vol. 7, No. 2, pp. 225-234.

Ye L. P., Lu X. Z., Ma Q. L., Wang X. L. and Miao Z. W. (2006). ˇăSeismic Nonlinear Analytical Models, Methods and Examples for Concrete Structuresˇ±, Engineering Mechanics, Vol. 23, No. Sup. II, pp. 131-140.

LIST OF TABLES

Table 1. Summary of the computational models

LIST OF FIGURES

Figure 1. BirdˇŔs view of Xuankou School after earthquake

Figure 2. Plane layout of Classroom Building A

Figure 3. Seismic damage in Classroom Building A

Figure 4. Seismic damage in Classroom Building B and C

Figure 5. Failure modes of classroom buildings

Figure 6. Plan layout of Office Building H

Figure 7. Seismic damage in Office Building H

Figure 8. Uniaxial stress-strain relationship of concrete

Figure 9. Uniaxial stress-strain relationship of steel

Figure 10. Failure mode predicted by Macro-model A subjected to Wenchuan NS+UD ground motions

Figure 11. Failure mode predicted by Macro-model B subjected to Wenchuan NS+UD ground motions

Figure 12. Micro-macro-scale hybrid model

Figure 13. Roof displacement of Classroom Building A subjected to Wenchuan NS+UD ground motions

Figure 14. Plastic zone in the bottom story subjected to Wenchuan NS+UD ground motions (the Hybrid-model)

Figure 15. Failure mode predicted by Macro-model C subjected to Wenchuan NS+UD ground motions

Figure 16. Failure modes with different footing rotational stiffness

Figure 17. Seismic damage predicted by Macro-model D subjected to Wenchuan EW+UD ground motions

Figure 18. Seismic damage predicted by Macro-model D subjected to Wenchuan NS+UD ground motions

Figure 19. Typical failure mode of Office Building H from IDA

Figure 20. Comparison of collapse fragility curves

Figure 21. Seismic damage predicted by Macro-model E subjected to Wenchuan NS+UD ground motions

Figure A1. The local coordinates in the interface between micro- and macro-scale parts

LIST OF SYMBOLS

Mc: design bending moment of the column

Mb: design bending moment of the beam

hc: moment amplification factor

Sa(T1): spectral acceleration of ground motion at the fundamental period T1

Sa(T1),MCE: the design spectral acceleration at the fundamental period T1 for maximal considered earthquake (MCE)


Table 1. Summary of the computational models

Model No.

Model name

Background Structure

Numerical model

Floor slabs

Footing rotation

1

Macro-model A

Classroom Building A

Fibre-beam-element model

Not considered

Not considered

2

Macro-model B

Classroom Building A

Fibre-beam-element model

Considered

Not considered

3

Macro-model C

Classroom Building A

Fibre-beam-element model

Considered

Considered

4

Hybrid-model

Classroom Building A

Micro-macro-scale hybrid model

Considered

Considered

5

Macro-model D

Office Building H

Fibre-beam-element model

Considered

Considered

6

Macro-model E

Same as Macro-model C but the sections of the columns in the bottom 2 stories are enlarged to 500mmˇă500mm


Figure 1. Bird¡¯s view of Xuankou School after earthquak

Figure 1. BirdˇŔs view of Xuankou School after earthquake
(From Xinhua News Agency)

Figure 2. Plane layout of Classroom Building A (unit: mm)

Figure 2. Plane layout of Classroom Building A (unit: mm)


Figure 3. Seismic damage in Classroom Building A

(a) South view

Figure 3. Seismic damage in Classroom Building A

(b) Northeast view

Figure 3. Seismic damage in Classroom Building A

(c) Northwest view

Figure 3. Seismic damage in Classroom Building A

(d) Plastic hinges in the columns

Figure 3. Seismic damage in Classroom Building A

Figure 4. Seismic damage in Classroom Building B and C

Figure 4. Seismic damage in Classroom Building B and C

(a)  Seismic damage in Classroom Building B

(b)  Seismic damage in Classroom Building C

Figure 4. Seismic damage in Classroom Building B and C

Figure 5. Failure modes of classroom buildings

Figure 5. Failure modes of classroom buildings

Figure 6. Plan layout of Office Building H (unit: mm)

Figure 6. Plan layout of Office Building H (unit: mm)

(a) Southwest view

(b) Damage at the top stories due to the collision with adjacent classroom building

Figure 7. Seismic damage in Office Building H

Figure 8. Uniaxial stress-strain relationship of concrete

Figure 8. Uniaxial stress-strain relationship of concrete

(a) Backbone curves of confined and unconfined concrete

(b) Hysteretic curve

Figure 8. Uniaxial stress-strain relationship of concrete

Figure 9. Uniaxial stress-strain relationship of steel

Figure 9. Uniaxial stress-strain relationship of steel

(a) Backbone curve

(b) Hysteretic curve

Figure 9. Uniaxial stress-strain relationship of steel


Figure 10. Failure mode predicted by Macro-model A subjected to Wenchuan NS+UD ground motions

(a) Before collapse (t=16.68s)

Figure 10. Failure mode predicted by Macro-model A subjected to Wenchuan NS+UD ground motions

(b) During collapse process (t=16.94s)

Figure 10. Failure mode predicted by Macro-model A subjected to Wenchuan NS+UD ground motions

( : Plastic hinge in beam; : Plastic hinge in column; : Failure point)

Figure 11. Failure mode predicted by Macro-model B subjected to Wenchuan NS+UD ground motions

(a) Before collapse (t=17.86s)

Figure 11. Failure mode predicted by Macro-model B subjected to Wenchuan NS+UD ground motions

(b) During collapse process  (t=18.10s)

Figure 11. Failure mode predicted by Macro-model B subjected to Wenchuan NS+UD ground motions

( : Plastic hinge in beam; : Plastic hinge in column; : Failure point)


Figure 12. Micro-macro-scale hybrid model

Figure 12. Micro-macro-scale hybrid model

Figure 13. Roof displacement of Classroom Building A subjected to Wenchuan NS+UD ground motions

Figure 13. Roof displacement of Classroom Building A subjected to Wenchuan NS+UD ground motions

Figure 14. Plastic zone in the bottom story subjected to Wenchuan NS+UD ground motions (Hybrid-model)

Figure 14. Plastic zone in the bottom story subjected to Wenchuan NS+UD ground motions (Hybrid-model)

(a) Before collapse (t=17.42s)

(b) During collapse process (t=17.72s)

Figure 14. Plastic zone in the bottom story subjected to Wenchuan NS+UD ground motions (Hybrid-model)

Figure 15. Failure mode predicted by Macro-model C subjected to Wenchuan NS+UD ground motions

(a) Before collapse
(t=17.42s)

Figure 15. Failure mode predicted by Macro-model C subjected to Wenchuan NS+UD ground motions

(b) During collapse process
(t=17.72s)

Figure 15. Failure mode predicted by Macro-model C subjected to Wenchuan NS+UD ground motions

(c) During collapse process
(t=18.08s)

Figure 15. Failure mode predicted by Macro-model C subjected to Wenchuan NS+UD ground motions

( : Plastic hinge in beam; : Plastic hinge in column; : Failure point)

Figure 16. Failure modes with different footing rotational stiffness (t=17.42s)

Figure 16. Failure modes with different footing rotational stiffness (t=17.42s)

(a) Rotational stiffness=4900kNm/rad

(b) Rotational stiffness=9100kNm/rad

Figure 16. Failure modes with different footing rotational stiffness (t=17.42s)

( : Plastic hinge in beam; : Plastic hinge in column; : Failure point)

Figure 17. Seismic damage predicted by Macro-model D subjected to Wenchuan EW+UD ground motions   Figure 17. Seismic damage predicted by Macro-model D subjected to Wenchuan EW+UD ground motions

 (a) At the maximal roof deformation (t=18.90s) (b) End of the earthquake (t=80.00s)

Figure 17. Seismic damage predicted by Macro-model D subjected to Wenchuan EW+UD ground motions

( : Plastic hinge in beam; : Plastic hinge in column;)

Figure 18. Seismic damage predicted by Macro-model D subjected to Wenchuan NS+UD ground motions    Figure 18. Seismic damage predicted by Macro-model D subjected to Wenchuan NS+UD ground motions

 (a) At the maximal roof deformation (t=18.94s) (b) End of the earthquake (t=80.00s)

Figure 18. Seismic damage predicted by Macro-model D subjected to Wenchuan NS+UD ground motions

( : Plastic hinge in beam; : Plastic hinge in column;)

  Figure 19. Typical failure mode of Office Building H from IDA

Figure 19. Typical failure mode of Office Building H from IDA
(El-Centro 1940 ground motion
Ö¬Sa(T1)/ Sa(T1),MCE=7.4)

( : Plastic hinge in beam; : Plastic hinge in column; : Failure point)

Figure 20. Comparison of collapse fragility curves

Figure 20. Comparison of collapse fragility curves

Figure 21. Seismic damage predicted by Macro-model E subjected to Wenchuan NS+UD ground motions   Figure 21. Seismic damage predicted by Macro-model E subjected to Wenchuan NS+UD ground motions

(a) At the maximal roof deformation (t=19.00s) (b) End of the earthquake (t=80.00s)

Figure 21. Seismic damage predicted by Macro-model E subjected to Wenchuan NS+UD ground motions

( : Plastic hinge in beam; : Plastic hinge in column)

Figure A1. The local coordinates in the interface between  micro- and macro-scale parts

Figure A1. The local coordinates in the interface between
micro- and macro-scale parts

Introduction
Research
Application
Teaching
Publications
Download
Issues
Others


Our Lab

Collapse Prevention Committee