Collapse Simulation of RC High-Rise Building Induced by Extreme Earthquakes

Xiao Lu1, Xinzheng Lu1 [*] , Hong Guan2 and Lieping Ye1

1Department of Civil Engineering, Tsinghua University, Beijing 100084, China;

 2Griffith School of Engineering, Griffith University Gold Coast Campus, Queensland 4222, Australia

Earthquake Engineering & Structural Dynamics, 2013, 42(5): 705-723.

Download Full Text

ABSTRACT

Collapse resistance of high-rise buildings has become a research focus due to frequent occurrence of strong earthquakes and terrorist attacks in recent years. Research development has demonstrated that numerical simulation is becoming one of the most powerful tools for collapse analysis in addition to the conventional laboratory model tests and post-earthquake investigations. In this paper, a finite element (FE) method based numerical model encompassing fiber-beam element model, multi-layer shell model and elemental deactivation technique is proposed to predict collapse process of high-rise buildings subjected to extreme earthquake. The potential collapse processes are simulated for a simple 10-story reinforced concrete (RC) frame and two existing RC high-rise buildings of 18-story and 20-story frame-core tube systems. The influences of different failure criteria used are discussed in some detail. The analysis results indicate that the proposed numerical model is capable of simulating collapse process of existing high-rise buildings by identifying potentially weak components of the structure that may induce collapse. The study outcome will be beneficial to aid further development of optimal design philosophy.

KEY WORDS: collapse simulation; high-rise buildings; elemental deactivation; fiber-beam element model; multi-layer shell model;

DOI: 10.1002/eqe.2240

If you need the PDF version of this paper, please email to luxinzheng@sina.com


1.      INTRODUCTION

Collapse is a critical ultimate state for structures during extreme earthquakes. In the past century, collapse prevention has always been a key topic in earthquake engineering research. This research area has become increasingly significant in recent years due to frequent occurrence of natural (earthquakes) and man-made (terrorist attacks) disasters all over the world. The China¡¯s Wenchuan Earthquake in 2008, Haiti Earthquake in 2010, Chile Earthquake in 2010 and China¡¯s Yushu Earthquake in 2010 are just a few examples of such catastrophes.

In order to effectively prevent earthquake induced structural collapse, the collapse process and the failure modes of structures should be properly predicted. Large-scale shaking table tests have been used in an attempt to understand the fundamental mechanism and behaviour of earthquake induced structural collapse [1-3]. However such tests are very expensive and even the largest shaking table in the world cannot simulate the collapse of full-scale high-rise buildings. As an alternative, numerical simulation has been widely accepted as an important technique to study earthquake induced structural collapse, by which both collapse modes can be identified and the entire processes can be replicated to certain extent particularly for the initial collapse phases. In this respect, many researchers have conducted collapse simulation [4-9]. However most of these work only focused on collapse simulation of simple structures, such as simple reinforced concrete frames or bridges. Little work has been reported on the collapse simulation of existing high-rise buildings consisting of thousands of beams, columns, shear walls and floor slabs. This research gap has largely limited the applicability of the current collapse simulation technology to real construction projects.

From numerical point of view, structural collapse is a complicated process in which a continuum system is deteriorated into a discrete one. This further complicates the collapse simulation by numerical techniques. In numerical analysis, elasto-plastic deformation and energy dissipation before collapse must be accurately simulated. During the collapse process, rigid body movement, structural element fracture, and contact and collision of structural fragments must also be correctly modeled. All this brings a very high theoretical and computational requirement to numerical analysis models. Despite of the development of many numerical models, such as Discrete Element Models (DEM) [10-11] and Applied Element Method (AEM) [12-13] in simulating structural collapse and some important progresses have been made, these methods still have a long way before they can be used to simulate complicated real high-rise buildings. In view of this, the present study aims to develop a simulation model that is based on well-developed finite element (FE) framework to provide a feasible collapse simulation methodology for practical application. In the proposed FE model, the structural elements in RC buildings are modeled with fiber-beam elements and multi-layer shell elements, with which the micro-scale stress-strain law of materials can be directly related to the macro-scale elemental force-displacement relations. The fracture of structural elements is modeled by deactivating failed elements and refining element mesh. The contact and collision of structural fragments during collapse are simulated with appropriate contact algorithm. Time-history analyses are carried out to simulate the entire collapse process. Three numerical examples including two real high-rise RC frame-core tube buildings of 18 and 20 stories are analyzed to demonstrate the applicability and efficiency of the proposed collapse process.

2.      NUMERICAL MODEL

For RC structural elements, there exist a number of simplified numerical models such as the concentrated plastic hinge model for beams and columns [14], the three-vertical-line-element model [15] and the multiple-vertical-line-element model [16] for shear walls. In an attempt to properly simulate complex nonlinear behavior of structures and structural elements before and after collapse, in particular the complicated interaction between axial loads and bending moments in columns and coupled in-plane/out-plane bending and coupled in-plane bending-shear behavior in RC shear walls, the present study employs the fiber-beam element model for beams and columns, and multi-layer shell model for shear walls. For clarity of discussion, these models are briefly introduced as follows.

2.1.   Fiber-beam element model

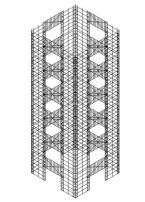
Fiber-beam element model has been widely accepted to model RC frames whose failure is predominately controlled by flexural behavior [17-18]. In the fiber-beam element model, the structural frames (beams and columns) are modeled with beam elements, and their sections are divided into individual fibers (Figure 1). Each fiber has its own uniaxial constitutive law, and different fibers in the same section follow the assumption that ¡°plane section remains plane¡±. The fiber-beam element model is capable of simulating the axial-flexural coupling of RC frames and is adaptive to different sectional shapes. The confinement effect of the stirrups in the columns can also be considered by using confined uniaxial constitutive relationship for core concrete and unconfined one for other concrete fibers. It is necessary to note that brittle shear failure is considered in the proposed fiber-beam mode. In other words, when the internal shear force exceeds the prescribed shear strength of the fiber-beam element, the strength and the stiffness of the element abruptly drop to zero.

The stress-strain model proposed by L¨¦geron et al. [19] is used in this study to model the backbone curve of concrete (Figure 2), which also considers the confinement of stirrups to concrete. Parabolic curves proposed by Mander et al. [20] are adopted to model the unloading and reloading paths of concrete where degradation of strength and stiffness due to cyclic loading (Figure 2) can be taken into account. An exponential model proposed by Jiang et al.[21] is used to model the softening branch of cracked concrete, with which the ¡°tension-stiffening effect¡± of reinforced concrete can be considered (Figure 2).

The stress-strain model proposed by Esmaeily and Xiao [22] is adopted to model the backbone curve of steel (Figure 3). The model proposed by L¨¦geron et al. [19] is adopted to model the unloading and reloading paths, in which the Bauschinger effect of steel can be considered (Figure 3).

Figure 1 Member section

Figure 1 Member section

Figure 2 Stress-strain curve of concrete

Figure 2 Stress-strain curve of concrete

Figure 3 Stress-strain curve of steel

Figure 3 Stress-strain curve of steel

Based on the above material models, the fiber-beam element model is embedded into the general purpose FE software MSC.MARC with the user subroutine UBEAM [23]. Each RC frame element (beam or column) is subdivided into 6 to 8 fiber-beam elements to ensure sufficient accuracy.

Two compressive-flexural column tests, referred to as S-1 [24] and YW0 [25] respectively, are simulated to validate the proposed fiber-beam element model. Detailed dimensions of S-1 and YW0 are shown in Figures 4 and 5, respectively. It can be seen that S-1 has a larger reinforcement ratio (2.65%) and a smaller axial load ratio (0.03) whereas YW0 has a smaller reinforcement ratio (1.29%) and a larger axial load ratio (0.44). Figures 4 and 5 also indicate that the numerical simulations perform fairly well to capture the model yielding, hardening and unloading characteristics. Even for the final stage of the hysteretic response when the deterioration becomes evident, the discrepancies between the simulation and test results are still within the acceptable range in engineering practice.

Figure 4 Comparison between numerical simulation and test results of S-1

Figure 4 Comparison between numerical simulation and test results of S-1

Figure 5 Comparison between numerical simulation and test results of YW0

Figure 5 Comparison between numerical simulation and test results of YW0


In order to further validate the reliability of the proposed model in predicting the actual strength deterioration, the progressive collapse test of a three-story four-bay planar frame carried out by Yi et al. [26] is simulated herein. The test setup and detailed dimensions are displayed in Figure 6. To represent the failure or removal of the middle column in the ground floor, the lower jacks unload gradually when the upper jack was balanced with load. Figure 7a shows a comparison between the experimental and simulated unloading curves for the middle column and Figure 7b presents the displacement comparison at selected points (located at the top of the columns on the first floor). Details of the simulation process can be found in Li et al. [27]. It is evident that the simulation results agree well with the experimental observations.

Figure 6 Collapse test of the planar frame by Yi et al.[26]

Figure 6 Collapse test of the planar frame by Yi et al.[26]

Figure 7 Comparison between simulation and test result of a four-bay three-story planar frame: (a) Unloading curve of middle column; (b) Displacement at the top of first-story columns   Figure 7 Comparison between simulation and test result of a four-bay three-story planar frame: (a) Unloading curve of middle column; (b) Displacement at the top of first-story columns

(a)                                                                                     (b)

Figure 7 Comparison between simulation and test result of a four-bay three-story planar frame: (a) Unloading curve of middle column; (b) Displacement at the top of first-story columns

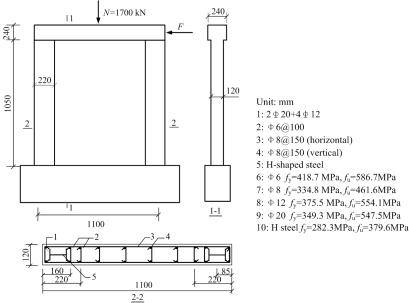
Furthermore, another compressive-flexural column test with large deterioration, conducted by Tang et al. [28], is also simulated to validate the capacity of the proposed fiber-beam model in predicting the strength deterioration in particular. Detailed dimensions and reinforcement arrangement are presented in Figure 8. The longitudinal reinforcement ratio of the specimen is 1.29% and the corresponding axial load ratio is 0.348. The hysteretic load-displacement comparison shown in Figure 8 indicates that the proposed fiber-beam model is able to replicate the strength deterioration within the considered acceptable range.

Figure 8 Comparison between numerical simulation and test results by Tang [28]

Figure 8 Comparison between numerical simulation and test results by Tang [28]


2.2.   Multi-layer shell model

The shear-wall members (walls and coupling beams) in the proposed FE model are simulated with multi-layer shell elements as illustrated in Figure 9. This type of element is based on the principles of composite material mechanics and is capable of simulating coupled in-plane/out-of-plane bending as well as in-plane direct shear and coupled bending-shear behavior of RC shear walls [29]. The multi-layer shell element is made up of a number of layers with different thicknesses and different material properties [30]. The rebars are smeared into one or more layers and these rebar layers can be either isotropic or orthotropic depending on the reinforcement ratio in the longitudinal and transverse directions, as shown in Figure 10. For the boundary zones of the shear wall, the essentially concentrated reinforcing bars are simulated using truss elements which are incorporated into the shell model. The elasto-plastic-fracture constitutive models [21, 31] provided by MSC.MARC and the steel model shown in Figure 3 are applied to the concrete and rebar materials, respectively. Since the multi-layer shell element directly relates the nonlinear behavior of the shear wall to the constitutive laws of concrete and steel, it has many advantages over other models in representing the complicated nonlinear behavior.

Figure 9 Multi-layer shell element

Figure 9 Multi-layer shell element

Figure 10 Location of the rebar layers

Figure 10 Location of the rebar layers

Figure 11 Specimen dimensions and reinforcement details

Figure 11 Specimen dimensions and reinforcement details

A shear wall test specimen [32] is simulated to validate the multi-layer shell element. The specimen is 1900mm in height, 1000mm in width and 100mm in thickness (Figure 11). The experimental and numerical load-displacement responses shown in Figure 12 demonstrate a good correlation in the yielding and hardening phases. Numerical predictions of the cracking strain contours at peak load state and the vertical compressive strain contours at ultimate state are respectively demonstrated in Figures 13a and 13b.

Figure 12 Comparison of load-displacement relation curves

Figure 12 Comparison of load-displacement relation curves

Figure 13 Deformation and strain contour predicted by the numerical model: (a) Cracking strain at peak load state; (b) Vertical compressive strain at ultimate state      Figure 13 Deformation and strain contour predicted by the numerical model: (a) Cracking strain at peak load state; (b) Vertical compressive strain at ultimate state

(a)                                     (b)

Figure 13 Deformation and strain contour predicted by the numerical model: (a) Cracking strain at peak load state; (b) Vertical compressive strain at ultimate state

Two RC tube specimens (referred to as TC1 and TC2) tested by Du et al. [33] are also simulated to further validate the proposed multi-layer shell model for shear walls. The size of both tubes is 1380mm¡°1380mm¡°3690mm. The axial load ratios of TC1 and TC2 calculated based on concrete compressive strength are 0.15 and 0.36 respectively. Inverted triangular lateral loads are applied to the middle and the top of the tubes. The FE model of shear walls and coupling beams are shown in Figure 14 and the arrangement of steel reinforcement in the specimens are detailed in Figure 15. All material data in the numerical model are determined based on the actual tests of Du et al. [33]. The concrete and distributed rebars in the longitudinal and transverse directions are simulated by the multi-layer shell model. The diagonal reinforcements in the coupling beams are simulated by traditional truss elements. For TC1 and TC2, the base shear force versus the top displacement curves are plotted in Figures 16 and 17 respectively. Again good agreements with the experimental results are achieved for both RC tube specimens. It is worth mentioning that the above validations confirm the ability of the FE model to accurately predict the yielding and hardening behavior of the test specimens. These laboratory tests however do not report on the strength deterioration and failure at ultimate stage therefore unable to provide a validation of the ability of the multi-layer shell model in replicating the deterioration pattern.

Figure 14 Concrete element mesh

Figure 14 Concrete element mesh

Figure 15 Spatial distribution of rebars

Figure 15 Spatial distribution of rebars

Figure 16 Comparison of shear force-displacement curves of TC1 (axial load ratio=0.15)

Figure 16 Comparison of shear force-displacement curves of TC1 (axial load ratio=0.15)

Figure 17Comparison of shear force-displacement curves of TC2 (axial load ratio=0.36)

Figure 17Comparison of shear force-displacement curves of TC2 (axial load ratio=0.36)

Consequently, another steel reinforced concrete (SRC) low shear wall test carried out by Wei et al.[34], is simulated to replicate the strength deterioration at large deformation. The specimen is 1050 mm in height, 1100mm in width and 120 mm in thickness. Reinforced concrete blocks were used at the top and the base to anchor the specimen. The distributed horizontal and vertical reinforcement were placed in two layers. The dimension, reinforcement and material properties of the specimen are briefly displayed in Figure 18. The horizontal cyclic load, initially controlled by the applied force and subsequently by displacement upon yielding, is applied at the top of the wall with a 1700kN axial compression load. The hysteretic load-displacement comparison between the simulation and test results is shown in Figure 19. It indicates that the multi-layer shell model performs well to simulate the load capacity and captures large deterioration of the specimen to some extent. The difference between the prediction and test results are considered acceptable. Based on the above validations, it can be concluded that the multi-layer shell model is capable of replicating shear wall behavior in collapse simulation.

Figure 18 Specimen dimensions and reinforcement details

Figure 18 Specimen dimensions and reinforcement details

  Figure 19 Comparison of load-displacement relation curves

Figure 19 Comparison of load-displacement relation curves


2.3.   Proposed elemental-failure criterion

During the process of structural collapse, the whole structure changes from a continuum system into discrete parts through structural fracturing and element crushing. This process can be simulated by elemental deactivation technique, where the failed elements are deactivated when a specified elemental-failure criterion is reached. Since both elemental models (fiber-beam element model and multi-layer shell model) are based on material stress-strain relations, corresponding material-related failure criterion must be adopted to monitor the failure of structural elements. For the fiber-beam element model, each element has at least 36 concrete fibers and 4 steel rebar fibers and each fiber has 3 Gauss integration points. Similarly, for the multi-layer shell model, each element has at least 10 layers (the number of layers depends on the specific situation of the actual reinforcement) and each layer has 4 Gaussian integration points. If the strain at any integration point in a fiber or layer (either concrete or steel) exceeds the material failure criterion, the stress and the stiffness of this fiber/layer are deactivated, which means that the fiber/layer no longer contributes to the stiffness computation of the whole structure. If all fibers/layers of an element are deactivated, the element is considered fully deactivated from the model. Simultaneously, the nodes that are connected to the deactivated element are checked. A node is considered ¡°isolated¡± when all its belonging elements are deactivated, which implies that this node carries zero stiffness in relation to the degree of freedoms (DOFs). The ¡°isolated¡± nodes are more likely to cause convergence problems. Therefore all DOFs of the ¡°isolated¡± nodes are removed from the global stiffness matrix [35].

Confined concrete (e.g. columns with sufficient stirrups) exhibits much better ductility than unconfined concrete (e.g. concrete in cover layer). Hence different criteria for concrete crushing are necessary for confined and unconfined concrete. Tensile rupture of rebar is also an important failure criterion for rebar fibers or layers. The fracture strain of rebar varies for different types of steel. Therefore it is treated as a variable factor and its influence is discussed herein. The rebar buckles following concrete crushing due to lack of concrete confinement. Due to complicated interaction between the confinement reinforcement (stirrups) and longitudinal rebars, the buckling strain of steel also varies significantly as demonstrated in different tests [36, 37] and is treated as a variable factor as well. Summarized below are typical material deactivating criteria proposed for this study:

(1)          For unconfined concrete crushing: compressive strain exceeds 0.33% [38];

(2)          For confined concrete crushing: the softening branch in Figure 2 approaching zero;

(3)          For rebar fracture: tensile strain exceeds 10% or 15% [38];

(4)          For rebar buckling: compressive strain exceeds 0.5% or 1.0%.

The influence of the above material failure criteria will be further discussed through presentation of numerical examples.

2.4.   Contact between failed structural segments

The contact and collision of failed structural fragments significantly influence the collapse failure mode. In this study, a contact algorithm specified in MSC.MARC software is adopted to simulate the interaction between failed structural segments and remaining active segments [35]. In the FE model, all the elements are defined as deformable contact bodies. During the incremental procedure, each potential contact node is checked to see whether it is in vicinity of a contact segment (elements defined as deformable contact bodies). If a node is within the contact tolerance, it is considered to be in contact with this segment. The default contact tolerance suggested in MSC.MARC is: the smaller of 5% of the smallest element side or 25% of the smallest (beam or shell) element thickness [35].

3.      COLLAPSE PROCESS SIMULATION

In general, collapse under strong earthquakes being considered in the design codes can be prevented in structures designed by the latest seismic design regulations. In practice, on the other hand, earthquakes are of complicated nature. As such, structures may experience extreme earthquakes that are much larger than those considered in the design regulations. Furthermore, for some research purposes such as collapse fragility analysis based on incremental dynamic analysis [39,40], and for building code development using collapse modeling [41], very large earthquake ground motions are required to be used as input to obtain a full collapse fragility curve from 0% to 100% of collapse. In view of the above, this study takes into account extreme ground motions which are 5 to 10 times larger than those specified in the design code [42]. Despite this assumption, the collapse simulation undertaken in this study aims to offer fundamental understanding of the ultimate structural behavior which will be beneficial for both scientific research and engineering application.

3.1.   Ten-story RC frame

The collapse process of a simple ten-story RC frame is simulated with the proposed fiber beam element model. The frame is assumed to be subjected to El-Centro EW Ground Motion [43] which is scaled to PGA=2000 gal. The overall configuration of the frame is presented in Figure 20. The columns are spaced at 5m with their feet fixing to the ground. The ground story is 4.5m high whereas all the other stories are 3m in height. The dimensions and longitudinal reinforcement of the beams and columns are given in Table 1. The material parameters of the analytical model are as follows: Young¡¯s Modulus E0 of 30GPa and the compressive strength fc of 30MPa for concrete, and Young¡¯s Modulus Es of 200GPa and the yield strength fy of 400MPa for reinforcement. The implicit single-step Houbolt algorithm [35] is adopted to compute the dynamic response of the frame. The iteration convergence criterion is the residual force being smaller than 1% of the maximum reaction force.

The predicted collapse process is shown in Figure 21 where soft stories are clearly identified. The numerical simulation reveals that failures of the frame initiate firstly in columns of the 8th story where the column sections change from 600mm´600mm to 500mm´500mm. Subsequent failures take place at ground story, where the columns carry the largest lateral force. The colored contours in Figure 21 represent the longitudinal reinforcement yielding in the columns and beams. Upon yielding of the longitudinal reinforcement in the columns of the 1st and 8th floors, the load-carrying capacities of the columns start to decline. The columns are therefore unable to resist the increased seismic loads and the additional bending moments caused by large displacement and P-D effect. Consequently, the 1st and 8th stories collapse completely at 4.4s at which very large lateral displacements are observed at the ground level. These results clearly show the potential failure mode and collapse process under the specific El-Centro ground motion which is scaled to PGA=2000 gal.


Figure 20 The plane and elevation of the 10-story RC frame

Figure 20 The plane and elevation of the 10-story RC frame

Figure 21 Collapse process of the 10-story RC frame (Ground motion: El-Centro EW, 1940, PGA=2000gal): (a) t=2s; (b) t =3s; (c) t =4s; (d) t =4.4s

Figure 21 Collapse process of the 10-story RC frame (Ground motion: El-Centro EW, 1940, PGA=2000gal): (a) t=2s; (b) t =3s; (c) t =4s; (d) t =4.4s

3.2.   Eighteen-story frame-core tube building

Shown in Figures 22 is the plane view of an existing high-rise building which has 18 stories above the ground and a 4-story basement with a total height of 74.8m. The core-tube is made up of four sub-tubes connected by coupling beams. The thickness of the shear wall changes from 500mm (at the bottom story) to 350mm (at the top story). The three dimensional FE model is presented in Figure 23a. The columns and beams are simulated by the fiber-beam element model, and the RC shear wall and coupling beams are simulated using the multi-layer shell model.

Modal Analysis is conducted herein which demonstrates three mode shapes. The first mode is translation in the Y-direction with a fundamental period T1=1.55s; the second mode is planar torsion with a natural period T2=1.30s; and the third mode is translation in the X-direction with secondary torsion, with a natural period T3=1.15s. The planar torsion in the second mode is caused by the asymmetric cantilevered portions of the building in the upper stories. The secondary torsion in the third mode is caused by the asymmetric layout of walls in the X-direction, which separates the center of rigidity from the center of mass.

El-Centro EW Ground Motion [43] which is scaled to PGA=1500gal is used as an earthquake input to the structure along the X-axis. Figure 23 clearly displays the potential collapse process of this high-rise building under El-Centro ground motion. The ground story is identified to be the weakest part of the building due to its much larger height than the other stories. As can be seen from Figure 23b, the failure of the shear wall starts from the outer flange of the core-tube in the ground floor, which is caused by the gravity load of the building and the over-turning effect of the seismic load. Note that in the outer flange of the core-tube, the compressive load is much larger than the shear force. Therefore, the failure of the shear wall is dominated by concrete crushing induced by the axial load and bending moment. Subsequently, significant force redistribution occurs in the ground floor. This in turn results in a steady increase in the vertical and horizontal forces in the columns thereby leading to buckling of the columns (as shown in Figure 23c). With an increase in time, collision occurs between the basement and the upper stories (Figure 23d) which in turn results in a total collapse of the ground floor and subsequently the whole building.

Figure 22 Standard plane layout of the 18-story building (Unit: mm)

Figure 22 Standard plane layout of the 18-story building (Unit: mm)

(a)                                                                                     (b)

          Figure 23 Collapse process of the 18-story frame-core tube building (Ground motion: El-Centro EW, 1940, PGA=1500gal): (a) t=0.0s; (b) t=3.9s; (c) t=4.9s; (d) t=6.8s

(c)                                                                                     (d)

Figure 23 Collapse process of the 18-story frame-core tube building (Ground motion: El-Centro EW, 1940, PGA=1500gal): (a) t=0.0s; (b) t=3.9s; (c) t=4.9s; (d) t=6.8s


3.3.   Twenty-story frame-core tube building

This structure is an existing 79.47m tall, 20-story office with a 4-story skirt building. The finite element model is shown in Figure 24. The lateral force resisting system of the building consists of reinforced concrete external frame and core tube. The cross-sectional dimensions of the columns from bottom to top of the building are 800mm´800mm, 700mm´700mm, 600mm´600mm. The beam sections are 350mm´650mm in the X-direction and 350mm´600mm in the Y-direction. The thickness of the core tube is 350mm.

Modal analysis is carried out using the proposed FE model. Three mode shapes are identified. The first mode is translation in the Y-direction with a natural period T1=2.25s; the second mode is translation in the X-direction with a secondary torsion due to asymmetric distribution of the shear wall in the X-direction and the corresponding natural period is T2=2.02s; the third mode is planar torsion, with a natural period T3=1.63s.

Illustrated in Figure 24 is the collapse process of this building subjected to El-Centro Ground Motion [43] which is scaled to PGA=4000gal. At t=4.5s, the shear wall at the 10th story has its concrete strength changed from C40 to C30 and the column section changes from 700mm´700mm to 600mm´600mm. This results in a sudden change in stiffness which in turn causes high stress concentration. In consequence, the shear wall at the flange of the core-tube in this story is crushed as demonstrated in Figure 24b. With propagation of the failed structural elements including buckled columns (Figure 24c), the stories above the 10th story comes down and impacts on the lower stories (Figure 24d), thereby leading to a progressive collapse of the whole building. The failure mechanism is similar to the eighteen-story frame-core tube building (Section 3.2) in which collapse is initiated by concrete crushing in the outer flange of the core-tube in the weak story.

It is worthwhile noting that due to the complicated nature of earthquakes and structures themselves, there may exist various failure modes and weak structural components. If the input ground motion of this building is changed to Duzce, Kocaeli, Turkey, 1999[43], the weak portion of the building is then changed to the first floor where there is a sudden change of stiffness induced by the discontinued underground diaphragm wall of the basement. The collapse process is presented in Figure 25. The discrepancy of the two collapse modes is attributable to different frequency components of the two ground motions. The Duzce ground motion is a pulse-like earthquake; however, the El-Centro ground motion is a duration-like earthquake. Therefore, the two ground motions excite different structural vibration modes which induce different collapse modes and processes. The collapse process under the Duzce ground motion suggests that further reinforcement should be provided in the first floor to improve the safety of the entire building.

To further compare the influence of failure criteria on the collapse simulation of the 20-story frame-core tube building, three different types of material failure criteria are adopted to determine collapse probability. A total of 22 far-field ground motions proposed by FEMA P695 [41] are input into the model and the fundamental period spectral acceleration (Sa(T1)) of each ground motion is scaled to 4.0g, where g is the acceleration of gravity. The respective collapse probabilities of the building under the 22 far-field ground motions are summarized in Table 2.

Table 2 clearly displays that if the tensile fracture strain of rebar changes from 15% to 10%, the collapse possibilities of the 20-story building remain the same; however if the bulking strain of the rebar changes from 1.0% to 0.5%, the collapse possibilities would increase from 63.6% to 81.8%. This implies that the buckling strain of rebar has a greater influence on the collapse probability. For this 20-story frame-core tube structure, collapse is mainly caused by compressive failure of the shear wall. Upon spalling of the concrete cover of the shear wall, the vertical rebar can easily buckle which has a great impact on the load bearing capacity of the shear wall. Therefore, the influence of buckling strain of rebar is evidently greater than the tensile fracture strain.

(a)                                                                                     (b)

Figure 24 Collapse process of the 20-story frame-core tube building (Ground motion: El-Centro, 1940, PGA=4000 gal): (a) t=0.0s; (b) t=4.5s; (c) t=5.1s; (d) t=7.5s

(c)                                                                                     (d)

Figure 24 Collapse process of the 20-story frame-core tube building (Ground motion: El-Centro, 1940, PGA=4000 gal): (a) t=0.0s; (b) t=4.5s; (c) t=5.1s; (d) t=7.5s

Figure 25 Collapse process of the 20-story frame-core tube building (Ground motion: Kocaeli, Turkey, PGA=4000 gal): (a) t=0.0s; (b) t=14.5s; (c) t=15.5s; (d) t=16.3s

(a)                                                                                     (b)

Figure 25 Collapse process of the 20-story frame-core tube building (Ground motion: Kocaeli, Turkey, PGA=4000 gal): (a) t=0.0s; (b) t=14.5s; (c) t=15.5s; (d) t=16.3s

(c)                                                                                     (d)

Figure 25 Collapse process of the 20-story frame-core tube building (Ground motion: Kocaeli, Turkey, PGA=4000 gal): (a) t=0.0s; (b) t=14.5s; (c) t=15.5s; (d) t=16.3s


4.      SUMMARY AND CONCLUSIONS

A numerical model based on the finite element framework, which consists of fiber-beam element model for beams/columns, multi-layer shell model for shear walls, and elemental failure criterion, is proposed. The possible failure modes, collapse processes, and weak portions of a simple 10-story RC frame and two existing RC frame-core tube high-rise buildings are simulated under specified ground motions. This study has provided a better understanding of the collapse mechanism of high-rise building structures under extreme earthquakes. The outcome of this study can also be used as references in engineering practice for collapse resistance design of similar building structures. More importantly, the study has offered some insight into the design philosophy in preventing collapse under extreme earthquakes which may contribute to further development of optimum design and structural health monitoring methodologies.

This paper presents a state-of-the-art approach to progressive collapse modeling. It should be noted that due to modest numbers of larger-scale collapse tests available in the literature, it is rather difficult to validate the collapse models of full-scale building systems presented in this study. Further work and validation are thus necessary on collapse simulation of full-scale structures or large-scale structural elements.

ACKNOWLEDGMENT

The authors are grateful for the financial support received from the National Nature Science Foundation of China (No. 90815025, 51178249), the National Key Technologies R&D Program (No. 2009BAJ28B01), Tsinghua University Research Funds (No. 2010THZ02-1, 2011THZ03) and the Program for New Century Excellent Talents in University (NCET-10-0528).

REFERENCES

1.      Li CS, Lam SSE, Zhang MZ, Wong YL. Shaking table test of a 1: 20 scale high-rise building with a transfer plate system. Journal of Structural Engineering 2006; 132(11):1732-1744.

2.      Wu CL, Kuo WW, Yang YS, Hwang SJ, Elwood KJ, Loh CH, Moehle JP. Collapse of a nonductile concrete frame: Shaking table tests. Earthquake Engineering and Structural Dynamics 2009; 38(2):205-224.

3.      Bothara JK, Dhakal RP, Mander JB. Seismic performance of an unreinforced masonry building: An experimental investigation. Earthquake Engineering and Structural Dynamics 2010; 39(1):45-68.

4.      Toi Y, Isobe D. Adaptively shifted integration technique for finite element collapse analysis of framed structures. International Journal for Numerical Methods in Engineering 1999; 36(14): 2323-2339.

5.      Lu XZ, Ye LP, Ma YH, Tang DY. Lessons from the collapse of typical RC frames in Xuankou School during the great Wenchuan Earthquake. Advances in Structural Engineering 2012; 15(1): 139-153.

6.      Isobe D, Tsuda M. Seismic collapse analysis of reinforced concrete framed structures using the finite element method. Earthquake Engineering and Structural Dynamics 2003; 32(13): 2027-2046.

7.      Lynn KM, Isobe D. Structural collapse analysis of framed structures under impact loads using ASI-Gauss finite element method. International Journal of Impact Engineer 2007; 34 (9): 1500-1516.

8.      Kang THK, Wallace JW, Elwood KJ. Nonlinear modeling of flat-plate systems. Journal of Structural Engineering-ASCE 2009; 135(2): 147-158.

9.      Yavari S, Elwood KJ, Wu CL. Collapse of a nonductile concrete frame: Evaluation of analytical models. Earthquake Engineering and Structural Dynamics 2009; 38(2):225-241.

10.   Alexandris A, Protopapa E, Psycharis I. Collapse mechanisms of masonry buildings derived by the distinct element method. In Proceedings of the 13th World Conference on Earthquake Engineering, Report No. 548. Vancouver, Canada, 2004.

11.   Lemos JV. Discrete element modeling of masonry structures. International Journal of Architectural Heritage 2007; 1(2):190 ¨C 213.

12.   Meguro K, Tagel-din HS. Applied element method used for large displacement structural analysis. Journal of Natural Disaster Science 2002; 24(1):25-34.

13.   Asprone D, Nanni A, Salem H, Tagel-Din H. Applied element method analysis of porous GFRP barrier subjected to blast. Advances in Structural Engineering 2010; 13(1):152-170.

14.   Ibarra LF, Krawinkler H. Global collapse of frame structures under seismic excitations. PEER Report 2005: 29-51.

15.   Kabeyasawa T, Shiohara T, Otani S, Aoyama H. Analysis of the full-scale seven story reinforced concrete test structures: Test PSD3. Proc. 3rd JTCC, US-Japan Cooperative Earthquake Research Program, BRI, Tsukuba, Japan, 1982.

16.   Li GQ, Zhou XM, Ding X. Models of reinforced concrete shear walls for nonlinear dynamic analysis. World Earthquake Engineering 2000; 16(2):13-18.

17.   Taucer FF, Spacone E, Filippou FC. A fiber beam-column element for seismic response analysis of reinforced concrete structures. Report No. UCB/EERC-91/17, UC Berkeley, American, 1991.

18.   Spacone E, Filippou FC, Taucer FF. Fibre beam-column model for non-linear analysis of R/C frames .1. Formulation. Earthquake Engineering and Structural Dynamics 1996; 25(7):711-725.

19.   L¨¦geron F, Paultre P, Mazar J. Damage mechanics modeling of nonlinear seismic behaviour of concrete structures. Journal of Structural Engineering 2005; 131(6): 946-954.

20.   Mander JB, Priestley MJN, Park R. Theoretical stress-strain model for confined concrete. Journal of Structural Engineering 1988; 114(8):804-1826.

21.   Jiang JJ, Lu XZ, Ye LP. Finite element analysis of concrete structure. Tsinghua University Press, Beijing, China, 2005.

22.   Esmaeily A, Xiao Y. Behavior of Reinforced Concrete Columns under Variable Axial Loads: Analysis. ACI Structural Journal 2005; 102(5):736-744.

23.   MSC.Software Corp. MSC.Marc Volume D: User Subroutines and Special Routines. 2005.

24.   Zatar W, Mutsuyoshi H. Residual displacements of concrete bridge piers subjected to near field earthquakes. ACI Structural Journal 2002; 99(6):740~749.

25.   Li J. Experimental investigation and theoretical analysis on seismic behavior of FS confined concrete columns. P.h.D. Thesis, Tsinghua University, Beijing ,China, 2003.

26.   Yi WJ, He QF, Xiao Y, Kunnath SK. Experimental study on progressive collapse-resistant behavior of reinforced concrete frame structures. ACI Structural Journal 2008; 105(4):443-439.

27.   Li Y, Lu XZ, Guan H, Ye LP. An improved tie force method for progressive collapse resistance design of reinforced concrete frame structures. Engineering Structures 2011; 33(10):2931-2942.

28.   Tang DY, Experimental and theoretical study on seismic collapse resistance of RC frame structures with equal span. Master thesis, Tsinghua University, Beijing, 2011.

29.   Miao ZW, Ye LP, Guan H, Lu XZ, Evaluation of modal and traditional pushover analyses in frame-shear-wall structures. Advances in Structural Engineering 2011; 14(5): 815-836.

30.   Guan H, Loo YC. Layered finite element method in cracking and failure analysis of beams and beam-column-slab connections. Structural Engineering and Mechanics 1997; 5(5):645-662.

31.   Lu XZ, Teng JG, Ye LP, Jiang JJ. Intermediate crack debonding in FRP-strengthened RC beams: FE analysis and strength model. Journal of Composite for Construction 2007; 11(2):161-174.

32.   Liu ZQ, Wu B, Lin SS. Study on seismic performance of reinforced concrete coupling beams. Earthquake Engineering and Engineering Vibration 2003; 23(5):117-124.

33.   Du XL, Jia P, Zhao J. Experimental study on seismic behavior of reinforced concrete core wall under different axial load ratio. Journal of Harbin Institute of Technology 2007; 39(Sup.2): 567-572.

34.   Wei Y, Qian JR, Zhao ZZ, Cai YY, Yu YQ, Shen L. Lateral loading experiment of SRC low shear walls with high axial force ratio. Industrial Construction 2007; 37(6):76-79.

35.   MSC.Software Corp. MSC.Marc Volume A: Theory and User Information. 2005.

36.   Rodriguez ME, Botero JC, Villa J. Cyclic stress-strain behavior of reinforcing steel including effect of buckling. Journal of Structural Engineering 1999; 125(6):605-612.

37.   Kunnath SK, Heo Y, Mohle JF. Nonlinear uniaxial material model for reinforcing steel bars. Journal of Structural Engineering 2009; 135(4):335-343.

38.   Ministry of Construction of the People¡¯s Republic of China. Code for design of concrete structures, Code No. GB-50010, China Architecture & Buildings Press, Beijing, 2002.

39.   Vamvatsikos D, Cornell CA. Incremental dynamic analysis. Earthquake Engineering and Structural Dynamics 2002; 31(3): 491¨C514.

40.   Mander JB, Dhakal RP, Mashiko N, Solberg KM. Incremental dynamic analysis applied to seismic financial risk assessment of bridges. Engineering Structures 2007; 29(10):2662-2672.

41.   FEMA, 2009, FEMA P695: Quantification of building seismic performance factors, Applied Technology Council, Redwood City, CA., 2009.

42.   Ministry of Construction of the People¡¯s Republic of China. Code for seismic design of buildings, Code No. GB-50011, China Architecture and Buildings Press, Beijing, 2010.

43.   Pacific Earthquake Engineering Research Center, University of California, Berkeley, California, http://peer.berkeley.edu/nga/, PRRE NGA Database, 2006.


List of Tables

Table 1 The cross-sectional parameters of the 10-story RC frame


Story

1

2

3

4

5

6

7

8

9

10

Beam

Section

(mm¡°mm )

300¡°800

250¡°700

250¡°700

250¡°700

250¡°700

250¡°700

250¡°700

250¡°700

250¡°700

250¡°700

Reinforcement

(mm2)

8000

5000

5000

5000

5000

5000

5000

5000

5000

5000

Side column

Section

(mm¡°mm)

700¡°700

700¡°700

700¡°700

700¡°700

600¡°600

600¡°600

600¡°600

500¡°500

500¡°500

500¡°500

Reinforcement

(mm2)

5000

5000

5000

3400

3400

3400

3400

2200

2200

2200

Mid-column

Section

(mm¡°mm)

700¡°700

700¡°700

700¡°700

700¡°700

600¡°600

600¡°600

600¡°600

500¡°500

500¡°500

500¡°500

Reinforcement

(mm2)

6000

6000

6000

6000

4400

4400

4400

3000

3000

3000

Note:

Reinforcements of beams and columns are symmetrically arranged.

Table 2 Collapse probabilities with different elemental failure criteria

Analysis cases

Tensile fracture strain of rebar

Buckling strain of rebar

Crushing strain of unconfined concrete

Collapse possibilities

1

15% 

1.0%

0.33%

63.6%

2

10%

1.0%

0.33%

63.6%

3

10%

0.5%

0.33%

81.8%


[*] Corresponding author.  Tel: +86-10-62795364; fax: +86-10-62795364

  E-mail address:  luxz@tsinghua.edu.cn

Introduction
Research
Application
Teaching
Publications
Download
Issues
Others


Our Lab

Collapse Prevention Committee