The seismic damage investigation of the Wenchuan Earthquake on May, 12, 2008 showed that the building
structures designed in accordance with the 2001 Code for seismic design
of buildings (GB50011-2001) and well controlled with construction
quality were performaned fine and could satisfy with the prescriptive
seismic fortification objectives (Wang YY, 2008; Ye et al., 2010). However,
since the actual seismic intensities may significantly exceeded the design
intensities, even by 2 to 4 degrees in some areas (i.e. Many buildings
with Seismic Fortification Intensity of 7 (referred to as SFI=7 for short
hereafter) experienced seismic intensity of 9 to 11), many building
structures, especially school buildings, were severely damaged and some
even collapsed (Civil and structural groups of Tsinghua University, Xinan
Jiaotong University and Beijing Jiaotong University, 2008). So after the
Wenchuan Earthquake, to enhance the seismic resistance of school buildings,
especially the collapse resistant capacity, were highly emphasized throughout
China. However, very limited research has been carried out on the quantitative
evaluation of the proper upgrading degree of the aseismic capacity of
structures. In June 2008, Report of Building Seismic Damage Survey
and Postearthquake Reconstruction Analysis (Chen and Qian, 2008)
issued by Division of Civil, Hydraulic and Architecture
Engineering of the Chinese Academy of Engineering,
proposed that building structures occupied by people unable to escape
from disasters rapidly, such as kindergartens, schools and nursing
homes etc. should be repairable after prescriptive maximum considered
earthquakes (MCE). This is equivalent to require the SFI be upgraded by one degree (e.g. Upgraded from SFI=7 to SFI=8).
Besides, the Standard for Classification of Seismic Protection of Building
Constructions (GB50223-2008) (GB, 2008) revised after the Wenchuan
Earthquake also adjusted the seismic design requirement for school buildings.
It requires that Seismic Design Category (SDC) of school buildings (including
teaching buildings, student dormitory and dinning room of kindergartens, primary and middle
schools) should not be lower than that for key
projects (i.e. SDC=B). So it can be found that the upgrading
requirements for school buildings in Chen & Qian (2008) and GB 50223-2008
(GB, 2008)
do not coincide. For example, according to the requirement of GB 50223-2008
(GB, 2008),
the school buildings located in zones with SFI=7 should be enhanced by
upgrading from SDC= C to SDC= B while its seismic design
load value is remained. But according to Chen & Qian (2008), the seismic
design load of the school buildings should be increased while the SDC is kept unchanged. Which one
of the two requirements is more rational? And with the above upgraded
design, how about the collapse possibilities of school buildings subjected
to MCE or Mega-earthquake (i.e. earthquake larger than MCE). Limited work
can be found in existing literatures.
Collapse prevention during strong earthquakes is the kernel objective of structural seismic design (Ye et al., 2008). In this work, the collapse resistant capacities of school buildings with different requirements are studied with incremental dynamic analysis (IDA). The collapse probabilities under MCE or Mega-earthquakes of different buildings are used as indicators to evaluate the collapse resistances (Ye et al., 2010). A set of reinforced concrete (RC) frame structures with different SFIs and different SDIs are designed and compared, to evaluate the effects of different upgrading requirements. Based on the analysis results some suggestions for enhancing the seismic capacity of school buildings are proposed.
2 Seismic design of the structures investigated
A representative five-storey RC frame classroom building with site class II and Seismic Design Group I according to 2001 Code for seismic design of buildings (GB, 2001) is selected for our parametrical study, considering five different SFIs, i.e., SFIs = 6, 7, 7.5, 8, and 8.5, and their corresponding PGA=0.05g, 0.10g, 0.15g, 0.20g and 0.30g, and two different SDCs, i.e., SDC=B and C). So a total of ten frames with the same configuration as illustrated in Fig. 1 were designed for different combination of SFIs and SDCs. Because pure frame structure is not suitable for buildings higher than five-storey in regions with SFI=9, the SFIs above 9 are not considered in this study. In our designing for all frames the minimal requirement of 2001 Code for seismic design of buildings (GB, 2001) was met so as to evaluate whether the specifications of the Code0 (GB, 2001) are adequate to ensure structural collapse resistant capacity. The design loads used are as follows:
|
(1) For floors: the dead load is 4kN/m2; the live load is 2kN/ m2; the dead load on staircase is 8.0kN/m2; the live load on staircase is 3.5kN/m2; the live load in aisle is 2.5kN/ m2. (2) For roofs: the dead load is 7kN/m2; the live load is 0.5kN/m2; the snow load is 0.5kN/m2. (3) For infilled walls£ºthe load of transverse walls is 9kN/m; the load of longitudinal walls is 6kN/m; the load of aisle balustrades and parapet walls is 2kN/m. Detailed information (size of cross-sections, material strengths and earthquake resistant constructional measure) is shown in Table 1. |
|
|
|
|
|
(a) Plane |
(b) Profile |
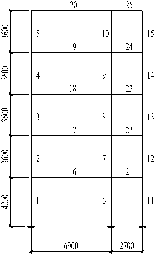
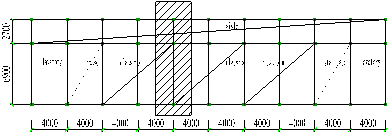
Fig. 1 Structural Layout
Table 1 Properties of the analyzed frames
|
Items |
Frame ID |
|||||||||
|
6C |
6B |
7C |
7B |
7.5C |
7.5B |
8C |
8B |
8.5C |
8.5B |
|
|
Column section on Axes A and B (mm) |
400¡Á400 |
400¡Á400 |
550¡Á550 |
600¡Á600 |
||||||
|
Column section on Axes C (mm) |
300¡Á300 |
350¡Á350 |
400¡Á400 |
400¡Á400 |
||||||
|
6.9m Spanning Beam section (mm) |
250¡Á600 |
250¡Á600 |
300¡Á600 |
300¡Á600 |
||||||
|
2.7m Spanning Beam section (mm) |
250¡Á400 |
250¡Á400 |
300¡Á450 |
300¡Á450 |
||||||
|
Earthquake resistant constructional measure |
Class 4 |
Class 3 |
Class 3 |
Class 2 |
Class 3 |
Class 2 |
Class 2 |
Class 1 |
Class 2 |
Class 1 |
|
Concrete Grade |
C20 |
C20 |
C20 |
C25 |
C20 |
C25 |
C20 |
C20 |
C20 |
C20 |
|
Reinforcement |
HRB400 for longitudinal bars, HRB335 for transverse reinforcement |
|||||||||
* The first number of the frame ID represents the SFI, the second B and C represent the SDC.
Table 2 Results of Seismic Calculation
|
Items |
Frame ID |
|||||||
|
6C, 6B |
7C |
7B |
7.5C |
7.5B |
8C, 8B |
8.5C, 8.5B |
||
|
Structural Gross Mass (t) |
2193 |
2212 |
2212 |
2212 |
2212 |
2467 |
2532 |
|
|
Fundamental Period (s) |
In X Direction |
1.2586 |
1.2124 |
1.1570 |
1.2124 |
1.1570 |
0.8700 |
0.8382 |
|
In Y Direction |
1.1957 |
1.1610 |
1.1079 |
1.1610 |
1.1079 |
0.8751 |
0.8422 |
|
|
Torsion |
1.1493 |
1.1098 |
1.0591 |
1.1098 |
1.0591 |
0.8339 |
0.8025 |
|
|
Base Shear (kN ) |
In X Direction |
344 |
707 |
736 |
1001 |
1041 |
2078 |
2185 |
|
In Y Direction |
360 |
744 |
775 |
1053 |
1096 |
2067 |
2171 |
|
|
Max. Inter-Storey Drift Ratio |
In X Direction |
1/1535 |
1/ 789 |
1/ 831 |
1/ 560 |
1/ 589 |
1/560 |
1/584 |
|
In Y Direction |
1/1675 |
1/ 861 |
1/ 907 |
1/ 610 |
1/ 643 |
1/570 |
1/594 |
|
|
Max. Axial Compression Ratio of Columns |
Side Columns |
0.76 |
0.79 |
0.64 |
0.81 |
0.66 |
0.51 |
0.44 |
|
Middle Columns |
0.84 |
0.85 |
0.69 |
0.86 |
0.70 |
0.53 |
0.45 |
|
|
Key Factors Dominating Cross-Section of Columns |
Gravity Loads |
Axial Compressive Force Ratio |
Axial Compressive Force Ratio and Inter-Storey Drift Ratio |
Inter-Storey Drift Ratio and Shear Capacity of Joints |
||||
The frames were designed by using PKPM design software according Chinese Codes (Lu & Wang, 2005). The major performance characteristics calculated are listed in Table 2 and the design results show that:
(1) For the frames with SFIs=6 and 7, the size of columns is mainly controlled by the gravity load or the axial compression ratio, i.e. the vertical gravity load dominates the design; while for the frames with SFI=7.5 to 8.5, the size of columns is mainly controlled by the inter-storey drifts or shear resistance of the column-beam joints, i.e. the horizontal seismic load dominates the design.
(2) With the same SFI, the frames with SDC=B or SDC=C have the same base shears. The frames with SDC=B has smaller axial compression ratio and slightly more stirrups in plastic-hinge region than the frames with SDC=C. The confinement of the stirrups to the concrete was modeled with the method proposed by L¨¦geron & Paultre (2005).
3 Collapse fragility analysis based on IDA
The IDAs for all frames were conducted in the frame lateral direction (in Fig. 1a, shaded) due to relatively low stiffness comparing to the longitudinal. The analytical models are built up in accordance with the designed results, which are shown in Fig. 2. 100% of dead gravity load and 50% of vertical live load within the shaded range are assigned to the frames.
The IDAs were implemented by using THUFIBER (Lu et al., 2009), fiber-beam-element package that was developed based on the general purpose finite element software MSC.MARC. The capacity and accuracy of the THUFIBER were discussed in detail by Ye et al. (2006) , Wang et al. (2007) and Li et al.(2011). Since THFIBER has excellent convergence performance in application for strong nonlinear problems such as collapse (Li et al., 2011, Lu et al. 2011). In the analyses following collapse criterion is used: the structure deformed so large so that the structure is unable further to provide enough free space for life safety. The definition of ¡Áenough free space for life safety¡± is effected by the structural type, the space, the story height and the function of different buildings. In this study, for the RC frames in Fig. 1, because the clear story height is less than three meters, and the classroom may be full of people during the earthquake, so the collapse criterion is further simplified as ¡Ámajor structural component drops vertically more than one meter during the time history analysis¡± (Lu et al., 2008). For other buildings, further study is needed to propose a rational criterion.
A set of 22 far-field ground motion records proposed by ATC-63 report (ATC, 2008), combined with the widely-used El-Centro ground motion records are used as the ground motion input in the IDA. As proposed by ATC-63 report (ATC, 2008) and Ye et al. (2009), the spectral acceleration at structural fundamental period (Sa(T1)) is selected as the ground motion intensity measure. For each model, the 23 ground motions are inputted one-by-one to implement the IDA. Under the assigned input motions of the same intensity, if there are n ground motions that result in structural collapse, then the collapse probability corresponding to this intensity is calculated as n/23. The collapse probabilities of different models under input motions of varied intensities are plotted in Fig. 3. By statistic test, the relationship between Sa(T1) and collapse probabilities basically follows the lognormal distribution (ATC, 2008). So the collapse fragility curves are obtained via lognormal distribution curve fitting (Fig. 3). These curves serve as important foundation for the collapse resistance evaluation.
|
|
|
|
|
|
(a) Model 6C |
(b) Model 6B |
(c) Model 7C |
(d) Model 7B |
|
|
|
|
|
|
(e) Model 7.5C |
(f) Model 7.5B |
(g) Model 8C |
(h) Model 8B |
|
|
|
||
|
(i) Model 8.5C |
(j) Model 8.5B |
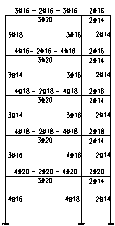
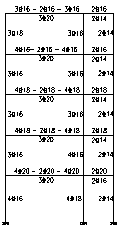
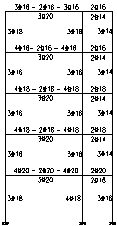
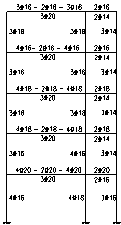
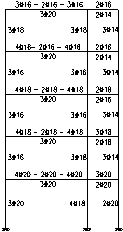
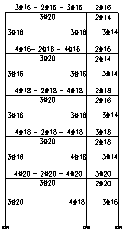
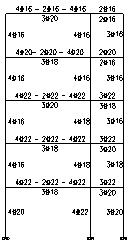
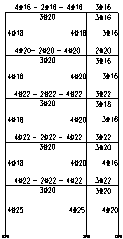
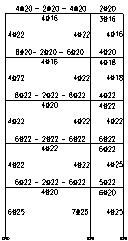
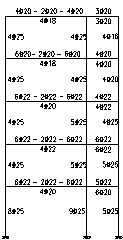
Fig. 2 Reinforcement in the frame models
|
|
|
|
6C: Sa(T1)50%Collapse=5.00m/s2 6B: Sa(T1)50%Collapse=4.99m/s2 |
7C: Sa(T1)50%Collapse=5.48 m/s2 7B: Sa(T1)50%Collapse=6.25 m/s2 |
|
(a) Models 6B & 6C |
(b) Models 7B & 7C |
|
|
|
|
7.5C: Sa(T1)50%Collapse=5.17m/s2 7.5B: Sa(T1)50%Collapse=7.47 m/s2 |
8C: Sa(T1)50%Collapse=14.30 m/s2 8B: Sa(T1)50%Collapse=17.77 m/s2 |
|
(c) Models 7.5B & 7.5C |
(d) Models 8B & 8C |
|
|
|
|
8.5C: Sa(T1)50%Collapse=34.70 m/s2 8.5B: Sa(T1)50%Collapse=41.80 m/s2 |
|
|
(e) Models 8.5B & 8.5C |
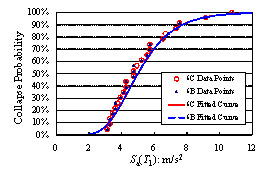
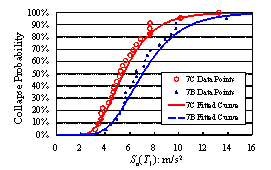

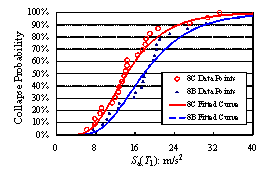
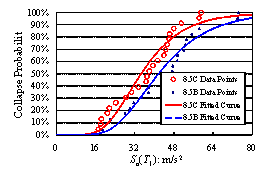
Fig. 3 Comparisons of collapse fragility curves of different frame models
4 Evaluation of the collapse resistant capacity
4.1 Ground motion intensity of MCE and earthquakes larger than MCE
Due to the complicated nature of earthquakes, China experienced devastating earthquakes that were larger than the design maximum considered earthquake (MCE) many times (Ye LP et al.,
2010). Therefore, to achieve the collapse prevention objective suggested by the National Key Technology Support Program (No. 2009BAJ28B01), three different levels of severe earthquake intensities are defined in this work, i.e. the ¡®Maximum Considered Earthquake¡¯ (MCE), ¡®Mega Earthquake Level I¡¯(ME-I) and ¡®Mega Earthquake Level II¡¯ (ME-II). Their corresponding PGAs are listed in Table 4.
Table 4 PGA values for earthquakes of three collapse-preventions levels
|
Earthquake Intensity (PGA) |
6(0.05g) |
7(0.10g) |
7(0.15g) |
8(0.20g) |
8(0.30g) |
9(0.40g) |
|
Fortification Intensity (cm/s2) |
50 |
100 |
150 |
200 |
300 |
400 |
|
Maximum Considered Earthquake (MCE) (cm/s2) |
110* |
220 |
310 |
400 |
510 |
620 |
|
Mega Earthquake Level I (ME-I) (cm/s2) |
220 |
400 |
510 |
620 |
730* |
930* |
|
Mega Earthquake Level II (ME-II) (cm/s2) |
400 |
620 |
620 |
930* |
930* |
¡ª |
The symbol ¡®*¡¯ denotes that this value is proposed by the authors.
4.2 Evaluation Indicator
To evaluate the difference of collapse resistances of different structures, ATC-63 project proposes Collapse Margin Ratio (CMR) (ATC, 2008) as the indicator. CMRi for the ith specified collapse-preventions level is defined as the ratio of the actual collapse resistance of the structure (in terms of intensity measure) to the earthquake intensity of the ith specified collapse-prevention level. So CMR is conceptually similar to the traditional safety factor. If Sa(T1), the spectral acceleration at the structural fundamental period T1, is selected as the intensity measure, the CMRi corresponding to Maximum Considered Earthquake (MCE), Mega Earthquake Level I (ME-I) and Mega Earthquake Level II (ME-II) are calculated as follows:
![]() (1)
(1)
i=MCE, ME-I and ME-II
where, Sa(T1)50%collapse is the intensity of the input motions under which 50% of ground motions will cause structural collapse. These CMRi values can be determined based on the Specification 5.1.4 and Table 4 in the Code for seismic design of buildings (GB50011-2001), together with the structural fundamental period.
Table 5 and Fig. 4 show the CMRs values corresponding to MCE, ME-I and ME-II obtained from the collapse fragility curves shown in Fig. 3. Note that generally, structural collapse resistant capacity increases with Sa(T1)50%collapse and CMR. Sa(T1)50%collapse represents the absolute magnitude of collapse resistant capacity, and it increases together with the SFIs (see Fig. 4a), whilst CMR represents a factor of the relative collapse resistant capacity of the structure, i.e., the safety margin of a structure to resist collapse when subjected to earthquakes that are larger than the design earthquake. So it is called as ¡ÁCollapse Margin Ratio¡± (Fig. 4b).
Table 5 Calculated collapse resistant indicators of different frame models
|
Model ID |
6C |
6B |
7C |
7B |
7.5C |
7.5B |
8C |
8B |
8.5C |
8.5B |
|
|
Sa(T1)50%Collapse (m/s2) |
5.00 |
4.99 |
5.48 |
7.05 |
5.85 |
7.47 |
14.30 |
17.77 |
34.70 |
41.80 |
|
|
MCE |
Sa(T1)MCE (m/s2) |
1.18 |
1.18 |
2.42 |
2.42 |
3.41 |
3.41 |
5.86 |
5.86 |
9.50 |
8.67 |
|
CMR |
4.28 |
4.24 |
2.27 |
2.91 |
1.72 |
2.19 |
2.44 |
3.03 |
3.65 |
4.82 |
|
|
Collapse Probability (%) |
0.001 |
0.001 |
1.03 |
0.10 |
5.34 |
0.89 |
1.89 |
0.38 |
0.032 |
0.002 |
|
|
ME-I |
Sa(T1)ME-I (m/s2) |
2.35 |
2.35 |
4.40 |
4.40 |
5.61 |
5.61 |
9.08 |
9.08 |
13.60 |
12.42 |
|
CMR |
2.13 |
2.12 |
1.25 |
1.60 |
1.04 |
1.33 |
1.58 |
1.96 |
2.55 |
3.37 |
|
|
Collapse Probability (%) |
1.29 |
1.38 |
26.7 |
8.62 |
45.2 |
19.4 |
14.5 |
5.30 |
0.683 |
0.07 |
|
|
ME-II |
Sa(T1)ME-II (m/s2) |
4.27 |
4.27 |
6.82 |
6.82 |
6.82 |
6.82 |
13.62 |
13.62 |
17.33 |
15.82 |
|
CMR |
1.17 |
1.17 |
0.80 |
1.03 |
0.86 |
1.09 |
1.05 |
1.30 |
2.00 |
2.64 |
|
|
Collapse Probability (%) |
32.1 |
32.5 |
73.2 |
46.2 |
67.6 |
39.2 |
45.5 |
26.1 |
3.37 |
0.53 |
|
The underlined values are unacceptable collapse probabilities.
|
|
|
|
(a) Sa(T1)50%Collapse (m/s2) |
(b) CMR |
|
|
|
|
(c) Collapse Probability |
|
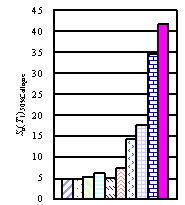
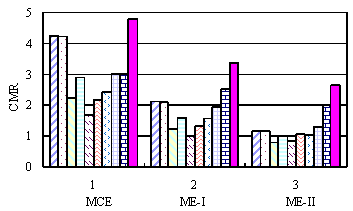

Fig. 4 Sa(T1)50%Collapse and CMR of different frame models
4.3 Evaluation of structural collapse resistant capacity
Sa(T1)50%Collapse is generally similar to the resistant capacity part of a structure the in structural design equations, and it represents the absolute intensity of collapse resistant capacity of the structure. Sa(T1)MCE, Sa(T1)ME-I and Sa(T1)ME-II are generally similar to the imposed action part in structural design equations, representing the intensity of the earthquake actions that the structure may encounter. Thus, CMR is a relative intensity as it is calculated by dividing resistant capacity by action. Decreasing the resistant capacity or increasing the seismic action will both result in the decrease of CMR, or the increase of collapse probability. Therefore, the evaluation of structural collapse resistant capacity needs to consider both the absolute intensities (i.e. Sa(T1)50%Collapse) and their corresponding CMRs.
From the comparison of the frames in this work, following conclusions can be found:
(1) The frames with SFI=6 and SDC=B and C have the lowest absolute collapse resistances because of the lowest SFI. However, due to the small design seismic load, their CMRs are comparatively fairly high. It should be noticed that upgrading Seismic Design Category from C to B hardly enhances the collapse resistant capacity for the frames with SFI=6. Collapse probabilities of the frame with SFI=6 and SDC=B under ME-II (PGA=400gal) is totally unacceptable.
(2) The absolute collapse resistances of the frames with SFI=7 and SDC=C are also relatively low. Its collapse probability under ME-I (PGA=400gal) is already unacceptable; Meanwhile, enhancing frame structures with SFI=7 by upgrading Seismic Design Category from C to B results in slightly lower axial compression ratio, while the reinforcement almost remains unchanged. So the decrease of collapse probability is not significant.
(3) The absolute collapse resistances of the frames with SFI=7.5 and SDC=C are also relatively low too. This is because the axial compression ratio of the frame columns is relatively high (Tang et al., 2009; Tang et al., 2010), and also because the inter-storey drift subjected to design earthquake already approaches to the critical value of 1/550. Therefore, its collapse safety margin is seriously inadequate. Its collapse probability under MCE (PGA=310gal) is already unacceptable. The frame with SFI=7.5 and SDC=B generally has the similar reinforcement as the frame with SFI=7.5 and SDC=C, but the axial compression ratio is slightly decreased. So its collapse possibility is smaller. But its collapse probability subjected to ME-I (PGA=510gal) is still unacceptable.
(4) The design of the frames with SFI=8 and SDC=B/C is controlled by inter-storey drift limitation, and the values of axial compression ratios of the frames are relatively moderate. Besides, their absolute collapse resistances are relatively high. The reinforcement of the frame with SDC=B is slightly more than that of the frame with SDC=C. The collapse probabilities of the frame with SFI=8 and SDC=B subjected to MCE (PGA=400gal), ME-I (PGA=620gal) and ME-II (PGA=930gal) are acceptable.
(5) The frames with SFI=8.5 and SDC=B/C has the similar conclusion as the frames with SFI=8. The collapse probabilities of the frame with SFI=8.5 and SDC=C subjected to MCE, ME-I and ME-II are acceptable. So it is not necessary to further upgrade its seismic design.
Furthermore, the comparison of the collapse resistant capacities for various SFIs shows that:
(1) For the frames with SFI=6, 7 and 7.5, there is no obvious difference among their absolute collapse resistances (i.e. Sa(T1)50%collapse). So generally, the CMRs of the frames with SFI=7~7.5 is too small and collapse probabilities are relatively high. Particularly when subjected to Mega-earthquakes, the collapse probabilities are totally unacceptable.
(2) The absolute collapse resistances of the frames with SFI=8 are much higher than those of the frames with SFI=7 or 7.5. Similarly, for the frames with SFI=8.5, their absolute collapse resistances are also greatly increased as compared to the frames with SFI=8. And the CMRs are also considerably increased. So the collapse resistance of the frames with SFI=8.5 are also quite good.
The above discussion shows that the absolute collapse resistance of the frames with SFI=7 and SFI=7.5 have no significant difference as compared to the frames with SFI=6. And their CMRs are also relatively low. So they are more vulnerable in earthquakes. The investigation of the Wenchuan Earthquake also proved that the regions with SFI=7 had the most serious seismic damage (Civil and structural groups of Tsinghua University, Xinan Jiaotong University and Beijing Jiaotong University, 2008; CCPH, 2008)
For example, among the 123 frame structures investigated by Prof. Yayong Wang (Wang, 2008), 8 structures had to immediately stop functioning and 9 structures (include those collapsed) had to be demolished immediately. The summed proportion of the two situations is 13.8%.
According to the social reflection after the Wenchuan Earthquake, such proportion is hardly to be accepted. Moreover, Yushu has a SFI of 7.5 and the seismic damage in Yushu Earthquake was also very serious (Yin, 2010).
Based on the structures studied in this paper, the absolute collapse resistance of the frames whose SFI¡º7.5 are too small. So when severe earthquake happens, the collapse probability will be very high. An effective method to increase the collapse resistance of the frames with SFI=6~7.5 is to reduce their axial compression ratio. The size of the frame columns should be larger than the minimal requirement of the Seismic Design Code (GB, 2001). And for the frames with SDC=B, the seismic design load should also be increased (i.e. upgrading the design intensity) to increase the absolute collapse resistance.
According to Tao (1990), in China, zones with SFI below 6 are about 201 million km2, i.e., about 21% of the total land area of China. Zones with SFI=6 and SFI=7 to 7.5 are respectively about 361 and 320 million km2, about 38% and 33% of the total land area. Thus, Zones with SFI¡º7.5 is more than 92% of the land area of China. From the above discussion, frames with SFI¡º7.5 have relatively low absolute collapse resistance. Considering the possibility of earthquakes larger than the prescriptive fortification level, the important structures should be designed with upgraded design intensity for zone with SFI¡º7.5. Zones with SFI=8 or 8.5 are about 68 million km2, which is only about 7% of the total land area of China. The present study shows that the structures with SFI=8 and 8.5 has sufficient collapse resistance and the collapse probability under Mega-earthquake is still acceptable.
5 Conclusions and further studies
In this paper, ten representative reinforced concrete (RC) frame structures with different Seismic Fortification Intensities (SFIs) and different Seismic Design Categories (SDCs) were designed according to 2001 Code for Seismic Design of Buildings (GB50011-2001). The collapse resistant capacities of these frames in terms of collapse fragility curves were quantitatively evaluated via incremental dynamic analysis (IDA). The results show that upgrading SDC from C to B is appropriate for frames with SFI³8, and their collapse probabilities under Mega-earthquakes are acceptable. While for frames with SFIs from 6 to 7.5, their collapse probabilities under Mega-earthquakes are still unacceptable even their SDCs are upgraded from C to B. Considering the difficulties of current technologies to accurately predict future strong earthquakes, and especially the fact that zones with low SFI are likely to encounter Mega-earthquakes beyond the prescriptive fortification level, important building structures located in these zones should be enhanced by increasing their SFIs to ensure their collapse resistant safety.
Additionally, the derivation of collapse fragility curves in this study was implemented by assigning one-dimensional earthquake ground motion to the frame model. ATC-63 report (ATC, 2008) concludes that, providing the same earthquake ground motion input, the collapse probability of three-dimensional structure model is less than that of two-dimensional one; and for the same structure model, the collapse probability under three-dimensional earthquake ground motions is larger than that subjected to two-dimensional ones. Besides, for buildings with different structural types, the collapse probabilities under the same ground motion are also different (Tang et al., 2009). Therefore, the structural collapse resistant capacity and its evaluation need to be further systematically studied, so as to upgrade the structural seismic design of China consistently.
Acknowledgement:
The authors gratefully acknowledge the financial support provided by National Science Foundation of China (No. 90815025 & 51178249), the National Key Technologies R&D Program (No. 2009BAJ28B01, 2006BAJ03A02-01), Tsinghua University Research Funds (No. 2010THZ02-1) and Program for New Century Excellent Talents in University.
CCPH (2008), Atlas of the Wenchuan Earthquake Disaster, Chengdu: Chengdu Cartographic Publishing House.
Civil and structural groups of Tsinghua University, Xinan Jiaotong University and Beijing Jiaotong University (2008), ¡ÁAnalysis on Building Seismic Damage in Wenchuan Earthquake,¡± Journal of Building Structures, 29(4): 1-9. (in Chinese)
GB (2001), Code for Seismic Design of Buildings GB 50011-2001, Beijing: China Architecture and Building Press. (in Chinese)
GB (2008), Standard for Classification of Seismic Protection of Building Constructions GB 50223-2008, Beijing: China Architecture and Building Press. (in Chinese)
L¨¦geron F and Paultre P (2005), ¡ÁUniaxial Confinement Model for Normal and High-strength Concrete Columns¡± Journal of Structural Engineering, ASCE, 129(2): 241-252.
Li Y, Lu XZ, Guan H and Ye LP (2011), ¡ÁAn Improved Tie Force Method for Progressive Collapse Resistance Design of Reinforced Concrete Frame Structures,¡± Engineering Structures, 33(10): 2931¨C2942.
Lu XK, Wang D (2005), ¡ÁProblem that Application PKPM¡¯s Structure Design Software Should be Valued,¡± Sichuan Building Science, 31(5): 39-41. (in Chinese)
Lu X, Lu XZ, Zhang WK, Ye LP (2011). ¡ÁCollapse Simulation of A Super High-rise Building Subjected to Extremely Strong Earthquakes¡±. Sci China Tech Sci, 54(10): 2549£2560
Lu XZ, Lin XC, Ma YH, Li Y and Ye LP (2008), ¡ÁNumerical Simulation for the Progressive Collapse of Concrete Building due to Earthquake,¡± Proc. the 14th World Conference on Earthquake Engineering, Beijing, China, CDROM.
Lu XZ, Ye LP and Miao ZW (2009), Elasto-plastic Analysis of Building against Earthquake, Beijing: China Architecture and Building Press. (in Chinese)
Tang DY, Lu XZ, Ye LP and Shi W (2009), ¡ÁInfluence of Structural Parameters to the Seismic Collapse Resistance of RC Frames in 7-degree Seismic Fortification Zone,¡± Proc. 4th Int. Conf. on Protection of Structures against Hazards, Beijing, China: pp.331-338.
Tang DY, Lu XZ, Ye LP and Shi W (2010), ¡ÁInfluence of Axial Compression Ratio to the Seismic Collapse Resistance of RC Frame Structures,¡± Earthquake Resistant Engineering and Retrofitting, 32(5): 26-35. (in Chinese)
Tao XX (1990), ¡ÁOn the New National Seismic Zonation and the Seismic Intensity Zoning Map of China,¡± Journal of Natural Disasters, 1(1):99-109. (in Chinese)
Wang XL, Lu XZ and Ye LP (2007), ¡ÁNumerical Simulation for the Hysteresis Behavior of RC Columns under Cyclic Loads,¡± Engineering Mechanics, 24(12): 76-81. (in Chinese)
Wang YY (2008), ¡ÁLessons Learnt from Building Damages in the Wenchuan Earthquake----Three Earthquake Performance Objectives and Basic Requirements For Seismic Design of Buildings,¡± Journal of Building Structures, 29(4): 26-33. (in Chinese)
Ye LP Ma QL, Miao ZW and Lu XZ (2009), ¡ÁStudy on Earthquake Intensities for Seismic Analysis,¡± Earthquake Engineering and Engineering Vibration, 29(4): 9-22. (in Chinese)
Ye LP, Lu XZ and Li Y (2010), ¡ÁDesign Objectives and Collapse Prevention for Building Structures in Mega-earthquake,¡± Earthquake Engineering and Engineering Vibration, 9(2): 189-200.
Ye LP, Lu XZ, Ma QL, Wang XL and Miao ZW (2006), ¡ÁSeismic Nonlinear Analytical Models, Methods and Examples for Concrete Structures,¡± Engineering Mechanics, 23(sup. II): 131-140. (in Chinese)
Ye LP, Qu Z, Lu XZ and Feng P (2008), ¡ÁCollapse Prevention of Building Structures: A Lesson from the Wenchuan Earthquake,¡± Journal of Building Structures, 29(4): 42-50. (in Chinese)