Progressive-collapse Simulation and Critical Region Identification of a Stone Arch Bridge

Zhen Xu [1] , Xinzheng Lu [2] , Hong Guan [3] , Xiao Lu [4] and Aizhu Ren [5]

[1] Doctoral Candidate, Department of Civil Engineering, Tsinghua University, Beijing 100084, China.

[2] Associate Professor, Department of Civil Engineering, Tsinghua University, Beijing 100084, China (corresponding author).Email: luxz@tsinghua.edu.cn.

[3] Associate Professor, Griffith School of Engineering, Griffith University Gold Coast Campus, Queensland 4222, Australia.

[4] Doctoral Candidate, Department of Civil Engineering, Tsinghua University, Beijing 100084, China.

[5] Professor, Department of Civil Engineering, Tsinghua University, Beijing 100084, China.

Journal of Performance of Constructed Facilities-ASCE, 2013, 27(1): 43-52.

Download Full Text

Abstract: Progressive collapses of arch bridges have repeatedly occurred in recent years, resulting in many casualties and significant property losses. Based on an actual recent and serious progressive collapse of a stone arch bridge, this paper simulated the complete progressive-collapse process using the general purpose finite element (FE) program, MSC.Marc. The simulation adopted a 3D FE model and performed a nonlinear analysis using the contact algorithm in conjunction with the element deactivation technique. The potential causes of the progressive-collapse of the stone arch bridge were also evaluated. Furthermore, the importance of different components of the stone arch bridge was determined with the conception of generalized structural stiffness; thus, the most critical and vulnerable regions of the bridge were identified. The results of the simulated progressive-collapse process agreed well with the actual process, and the predicted critical regions were both correct and realistic. This study also provides important references for the analysis and prevention of progressive collapses of stone arch bridges.

doi:10.1061/(ASCE)CF.1943-5509.0000329

If you need the PDF version of this paper, please email to luxinzheng@sina.com

Introduction

The arch bridge, a conventional bridge type, is widely used throughout the world and is important in bridge engineering (Yao 2008). However, there has been frequent occurrence of collapses of arch bridges. In the last 14 years, more than 5 progressive collapses of arch bridges have been reported in China, resulting in more than 100 casualties (Chen 2008). Furthermore, amongst the different types of arch bridges, stone arch bridges are the most sensitive to local damages, particularly around the arch ring and arch feet (Zhou et al. 2008). Several typical stone arch bridge collapses are enumerated herein. In 1989, UK¡¯s Ness stone arch bridge in Inverness collapsed due to a flood (Scott 1995). In 1993, the Kenyan stone arch bridge that connected Nairobi and Mombasa collapsed due to a flood and subsequently, a train fell from the bridge, killing 144 people (Scheer 2000). In 2006, China¡¯s Yaohe stone arch bridge collapsed unexpectedly. In 2007, China¡¯s Fenghuang stone arch bridge also collapsed, where 64 people perished (Chen 2008). These catastrophic events have raised an increasing concern for bridge engineers and researchers. To ensure the integrity and safety of stone arch bridges, it is extremely important to analyze the potential causes of progressive collapses and to determine the most critical regions of the bridges, which will in turn provide useful references for bridge design, construction, maintenance and collapse prevention strategies for this important class of bridge structures.

The progressive collapse of bridges can be caused by several factors and thus, it is difficult to identify the major causes of a progressive collapse (LeBeau and Wadia-Fascetti 2007; Biezma and Schanack 2007). Published research and engineering case studies have proven that simulating a progressive-collapse process can be an effective method to identify the major factors behind the collapse (Baylot 1997; Farrar and Jauregui 1998; Krauthammer et al. 2002; NIST 2008; NTSB 2008; Poston and West 2005). Different factors that may cause a collapse can be compared via repeated simulations to determine the most sensitive factor. In general, experimental simulations are able to provide more detailed information and are more reliable than numerical methods (Farrar and Jauregui 1998; Poston and West 2005). However, experimental simulations of a bridge collapse are very expensive, time-consuming and labor intensive, particularly when many repeated simulations are required to evaluate the influence of different factors. Differently, numerical simulations are much more efficient and can provide possible solutions to the discovery of causes of bridge collapses.

Stone arch bridges are made up of discrete blocks. In addition to the finite element method (FEM), the discrete element method (DEM) has also shown advantages in simulating the interaction between the stone bricks during a progressive collapse (Isobe and Tsuda 2003; Khandelwal 2008; Lu et al. 2009; Munjiza et al. 2004). With the rapid development of parallel computation, DEM is being used more and more to simulate progressive collapses of medium and large-sized stone arch bridges. Nevertheless, FEM is still more popular in engineering offices and has been successfully applied in many collapse simulations; for example, collapse analyses have been performed on the Kobar Towers, the World Trade Center and the I-35W Bridge (Baylot 1997; NIST 2008; NTSB 2008). Extensive research has been conducted on simulating the progressive collapse of stone arch bridges using FEM (Cavicchi and Gambarotta 2005; Drosopoulos et al. 2006; Kumar and Bhandari 2005; Loo and Yang 1991; Thavalingam et al. 2001). Furthermore, collapses of masonry structures have also been successfully simulated using FEM (Karapitta et al. 2010; Lofti and Shing 1994; Rots 1991). For this reason, FEM was chosen in this study to simulate the progressive collapse of a stone arch bridge.  

Despite the aforementioned research efforts, previous studies on collapse simulations of stone arch bridges have focused on the collapse initiation only, not on a systematic simulation of the entire collapse process. The literature shows that FEM has been used to simulate the collapse process for concrete and steel structures (Lynn and Isobe 2007a; Lynn and Isobe 2007b; Kaewkulchai and Williamson 2004; Khandelwal 2008; Mattern et al. 2007; Pekau and Cui 2006; Lu et al. 2011). Several published works (Heyman 1969; Heyman 1993; Kumar and Bhandari 2005) have offered valuable references with regard to the progressive failure of stone arches; however, the challenges in simulating stone arch bridges is that they exhibit discontinuous features due to the existence of discrete blocks. Special treatment is thus needed to handle the separation and interaction between the stone blocks. Therefore, in this study, it was necessary to simulate a complete progressive-collapse process of stone arch bridges by accounting for their inherent discontinuous features.

A second objective of this study was to identify the critical and vulnerable regions of stone arch bridges. A survey on bridge collapse events (Wardhana and Hadipriono 2003) indicates that collapses are often caused by defects or damage at the critical regions during construction or the service stage. A bridge structure consists of a series of components, each of which has a different degree of importance subjected to external loads (Agarwal et al. 2001; Hu 2007; Liu and Liu 2004; Liu and Liu 2005; Nafday 2008). To ensure global integrity and safety, critical components and regions of the bridge should be given greater safety margins. Thus, the importance indices of the different structural components should be evaluated to determine where critical regions of stone arch bridges are located.

This paper describes simulating a complete progressive-collapse process using the general purpose FE program, MSC.Marc (MSC.Marc 2005a). A typical stone arch bridge collapse (Chen, 2008) is used as reference to in this work. Considering the discontinuous feature of stone arch bridges, element deactivation technology and the contact algorithm were used to describe the separation and interaction between the stone blocks, respectively. Based on the FE simulation and site investigation, the potential major causes for the progressive-collapse of the stone arch bridge were analyzed. In this study, importance indices based on the generalized structural stiffness for bridge collapse is also proposed and the critical regions of the stone arch bridge is identified. Upon verification of the identified critical regions via pushdown analysis, the results can be used to guide the design and construction of stone arch bridges, which could prevent potential bridge collapses in the future.

It should be noted that the collapse analysis of any stone arch bridge is a relatively complicated and daunting task because extensive work is required to gather information, such as site investigation reports on the rubble and debris from the collapsing bridge, the material testing records, and the witness descriptions. The FE simulation method presented in this paper has demonstrated its ability to perform a large number of repeated simulations, which also offers useful visualizations of the collapse process of the stone arch bridge. This in turn can aid in discovering the fundamental failure mechanisms and possible causes of stone arch bridge collapses. Therefore, the FE simulation work performed in this study will provide an important practice for collapse analyses of stone arch bridges. Furthermore, the simulation outcomes together with the identification of the critical regions can also reveal that defects or damage at the critical regions are important factors that influence the collapse of a stone arch bridge, which implies that the critical regions should be identified as soon as possible. In practice, proper strengthening and monitoring of these critical regions are effective solutions to prevent bridge collapses.

This paper presents a case study on a typical multi-span stone arch bridge, which is a common medium-sized or large-sized type of bridge. In addition, the causes of a collapse for this type of bridge are somewhat similar to that of other collapsed stone arch bridges in recent years. Thus, the outcomes from the progressive-collapse simulation of this case can provide important references for the collapse analyses of other similar stone arch bridges. More importantly, the identification method to determine the critical regions as proposed in this study can also be used to develop a rational design, construction, inspection and maintenance guideline, which would prevent other bridge collapse accidents.

Progressive collapse of a stone arch bridge

This research is based on a case study of a four 65-m span highway stone arch bridge that was 328.54 m in length, 13 m in width and 42 m in height. The height-length ratio of each of the four arches was 1/5, and the thickness of the primary arches was 1.35 m. The elevation of the bridge is shown in Fig. 1, where Piers 0 to 4 are also indicated.

Fig. 1. Elevation of stone arch bridge (Unit: m)

Fig. 1. Elevation of stone arch bridge (Unit: m)

The available information on the structural design of the stone arch bridge suggests that the four arches were connected simultaneously to the piers. Therefore, Piers 1 to 3 were designed in such a way that they must not carry unbalanced horizontal forces from the adjoining primary arches. During the final phase of construction in August 2007, the bridge collapsed unexpectedly without warning when the temporary supports near the primary arch of the first span were removed. Piers 1, 2 and 3 consecutively fell over onto Pier 0 causing a progressive collapse of the entire bridge. The sight of the accident is shown in Fig. 2 along with the reported serious casualties and property losses (Long 2007).

Fig. 2. Sight of bridge collapse accident

(a) Sight 1

Fig. 2. Sight of bridge collapse accident

(b) Sight 2

Fig. 2. Sight of bridge collapse accident

Base on the description of witness reports and the site investigation, two possible reasons behind the progressive collapse of the bridge were suggested (Chen 2008). The first reason is that the strength of the arch between Pier 0 and Pier 1 might have been well below the design value. The arch was designed to be built with regular block stones. However, during construction, a large amount of rubble stones were used instead. As recommended by the Chinese Code for Design of Highway Masonry Bridges and Culverts (MTPRC 2005), when regular block stones are replaced with rubble stones, the ultimate strength is reduced by 34%. Additionally, it was suggested that the strength of the mortar between the stones was low, again below the design value. Therefore, the actual ultimate strength of the arch was estimated to be approximately 51.3% of the original design strength. The other possible reason is that the horizontal displacement of Pier 0 was too large. The progressive collapse of the bridge was initiated at the first span. It was observed during construction that the foundation of Pier 0 appeared to have cracked. Although injection grout measurement of cracks was adopted in the Pier 0 foundation, Pier 0 might have moved horizontally if the injection grout was not effective. Such a horizontal displacement would result in an additional bending moment, which would cause the collapse of the first arch. To identify and confirm the aforementioned major causes of the collapse, an FE simulation was performed to evaluate the key factors as speculated above.

Finite element model

The FE model of the stone arch bridge was created using the general purpose FE program, MSC.Marc (MSC.Marc 2005a), which contains a comprehensive nonlinear analysis capacity. For a global collapse analysis, individual stone blocks are too small to be modeled as finite elements. Instead, the entire bridge is meshed with 3D hexahedral elements. It should be noted that a 2D FE simulation is possible in practice because, in general, bridge components are in plane-stress states under a gravity load. Nevertheless, a 3D analysis was conducted in this study to obtain a detailed and accurate simulation of the actual progressive collapse process. A 3D analysis also offers a better visualization of the collapse.

The mesh sizes of the present FE model were determined based on the work of Fanning and Boothby (2001), who established a similar 3D FE model of a stone arch bridge, and the simulation was proven accurate compared with an experiment. Cavicchi and Gambarotta (2005) and Thavalingam et al. (2001) also followed similar mesh schemes as those of Fanning and Boothby (2001) for a stone arch bridge simulation. These published works have proven that a minimum element size that is less than 0.3 m generally ensures an accurate simulation. In this study, a convergence test of the FE model was also conducted to confirm the accuracy of the mesh sizes adopted. The FE model of the stone arch bridge is presented in Fig. 3. In this FE model, the ¡°foundation¡± elements are fully fixed on the sides and bottom. Note that the pier foundations do not level up due to the topographic feature of the river basin. It should be noted that the ¡°river basin¡± elements are simplifications of the actual basin because they are not part of the FE analysis; they are provided as a treatment technique to restrain the falling fragments of the bridge to the level of river basin.

Fig. 3. FE model of the stone arch bridge

(a) Entire model

Fig. 3. FE model of the stone arch bridge

(b) Details of structural components

Fig. 3. FE model of the stone arch bridge

In the arch bridge model, the stone and mortar are modeled with elastic-plastic-fracture material (Bažant and Planas 1997; Jiang et al. 2005). The Young¡¯s modulus and the yielding and cracking strengths of the different structural components are given in Table 1, as specified by the Chinese Code for Design of Highway Masonry Bridges and Culverts (MTPRC 2005). In addition, materials that have reached a certain level of damage should be removed from the numerical model. This is the so-called ¡°elemental deactivation¡± technology, which was used to remove failed elements. A rational element failure criterion is critical for an accurate simulation of the collapse process of a stone arch bridge. A total strain concept (Karapitta et al. 2010), which has been proven to be accurate and effective for unreinforced masonry structures, was therefore used as the elemental failure criterion. In other words, when the maximum tensile or compressive strain of an element exceeded the threshold value, a subroutine called, ¡°UACTIVE¡±, was then used to remove the element from the FE model (MSC.Marc 2005b).

In the actual bridge project, the piers were constructed on a natural foundation, which was located on slightly weathered rocks. When the horizontal forces on the piers exceeded their corresponding load capacity, the piers could slide horizontally or overturn, which would lead to a progressive collapse. Such movement cannot be simulated with the conventional fixed boundary conditions. To accurately simulate the interaction between the foundation and the pier, the Mohr-Coulomb friction contacts (MSC.Marc 2005c) were adopted between ¡°Pier01¡± and the ¡°foundation¡± elements in the model. The value of the friction coefficient was set to 0.55, according to the Chinese code for foundation design of highway bridges (MTPRC 2007).

Progressive-collapse simulation

Based on the possible collapse explanations suggested after the actual accident, two load cases were replicated. Note that the actual bridge collapsed without a traffic load. Consequently, only a gravity load was used in the FE simulation.

Load Case 1: Collapse due to insufficient material strength or poor construction quality of the first primary arch. Based on the material strength given in Table 1, the tensile and compressive strengths of the first primary arch were reduced accordingly following the previous discussions on the actual collapse accident; the Young's modulus, Poisson ratio and density remained unchanged. A gravity load was applied on the bridge in a step-by-step manner to simulate the removal of the temporary support before the collapse.

Load Case 2: Collapse due to a horizontal slide in the foundation of the left abutment. A gravity load was fully applied on the bridge. The left abutment was assumed to move leftwards in a step-by-step manner to simulate the horizontal slide in the foundation.

The two load cases and their corresponding FE analysis results are respectively demonstrated in Fig. 4 and Fig. 5.

(a) Initiation of collapse (t=1.36s)

(a) Initiation of collapse (t=1.36s)

(b) Collapse of first span (t=2.08s)

(b) Collapse of first span (t=2.08s)

(c) Collapse of second span (t=3.28s)

(c) Collapse of second span (t=3.28s)

(d) Collapse of third span (t=5.32s)

(d) Collapse of third span  (t=5.32s)

(e) Collapse of fourth span (t=7.90s)

(e) Collapse of fourth span (t=7.90s)

(f) Collapse of entire bridge (t=9.40s)

(f) Collapse of entire bridge  (t=9.40s)

Fig. 4. Simulated collapse process under Load Case 1

Figure 4 presents a typical development of the progressive collapse of a stone arch bridge. This process clearly indicates that due to insufficient strength of the first span, the collapse initiated at the first arch under a gravity load. The initial damages are generally uniformly distributed inside the first arch. Subsequently, the collapse of the first span triggered a large, unbalanced horizontal force at the top of Pier 1, which in turn resulted in a large horizontal displacement at the same location. This result significantly changed the equilibrium status of the second arch by inducing an additional, massive bending moment. The second span subsequently failed when its flexural stresses exceeded the flexural resistance of the stone arch. A similar process occurred in the third and fourth spans until the entire bridge collapsed.

(a) Initiation of collapse (t=1.38s)

(a) Initiation of collapse  (t=1.38s)

(b) Collapse of first span (t=2.16s)

(b) Collapse of first span (t=2.16s)

(c) Collapse of second span (t=3.72s)

(c) Collapse of second span (t=3.72s)

(d) Collapse of third span (t=5.82s)

(d) Collapse of third span (t=5.82s)

(e) Collapse of fourth span (t=7.62s)

(e) Collapse of fourth span (t=7.62s)

(f) Collapse of entire bridge (t=9.60s)

(f) Collapse of entire bridge (t=9.60s)

Fig. 5. Simulated collapse process under Load Case 2

The collapse process, illustrated in Fig. 5, indicates that following a large horizontal slide (greater than 100 mm) in the foundation of the left abutment, the axis of the first primary arch changed from its original position, inducing a significant, additional bending moment. Initial damage occurred in the skewback near Pier 0, where the largest additional bending moment existed, which led to the collapse of the first span.

The common characteristic between Load Case 1 and Load Case 2 is that the element failure progression was similar with time, which can be observed in Fig. 6. For both load cases, there were four jumps in the number of failed elements during the progressive-collapse process. These jumps corresponded to the collapse of the four spans of the arch bridge. This simulation result agrees well with the actual collapse accident, where the initiation of the first span collapse led to consecutive collapses of the second, third and final spans.

Fig. 6. The process of element failure in two load cases

Fig. 6. The process of element failure in two load cases

The primary differences between the two load cases are the locations of the initial damage. In Load Case 1, the initial damage was evenly distributed within the first primary arch, whereas in Load Case 2, the initial damage occurred at the skewback of the first primary arch. In addition, in Load Case 2, a significant horizontal displacement can be observed in the foundation of the abutment at the site of the bridge collapse. These differences can help identify the possible reasons of the progressive collapse. It was observed by the construction workers that the first primary arch displayed a large number of cracks and bended downward when the bridge began to collapse. This description was observed in the simulation of Load Case 1 but not observed in the simulation of Load Case 2. The simulation results of Load Case 2 showed that a progressive collapse will not occur until the horizontal displacement of Pier 0 is greater than 100 mm. However, such a large horizontal displacement during construction was not observed for Pier 0, which suggests that the primary reason behind the bridge collapse is associated with insufficient material strength of the first primary arch during construction.

Critical regions of a stone arch bridge

To prevent the collapse of stone arch bridges, it is necessary to fully understand their failure mechanisms and to improve global safety margins by focusing on the critical regions of the bridge. These regions can only be identified after evaluating the importance indices of the structural components of the bridges.

The importance indices of the structural components are related to the mechanical properties of the structural system itself and also the characteristics of the external loads. In addition, the importance indices are influenced by the targets of the structural performance design. A literature study shows that the existing methods that evaluate the importance indices can be divided into two categories (Agarwal et al. 2001; Liu and Liu 2005; Lu et al. 2009; Nafday 2008): load-independent evaluation methods and load-dependent evaluation methods.

The load-independent evaluation methods mainly focus on the characteristics of the structural system, and the importance indices of the structural members are evaluated from the perspective of the topology or the stiffness distribution of the structural system. Liu (2005), Hu (2007) and Nafday (2008) proposed the importance indices of components should be based on the effect of the components on the generalized structural stiffness. Liu and Liu (2004) evaluated the importance of the components using the affected area caused by the failed components. Other researchers (Ji and Lin 1995; Zhang and Li 1997) adopted the analytical hierarchy process (AHP) to evaluate the importance of different components.

The load-dependent evaluation methods consider not only the structural properties (stiffness, strength, topology, etc.) but also the characteristics of the loads (i.e., load distribution, magnitude, load path). Based on the system reliability theory, Gharaibeh (2002) defined the importance indices of components as the effect of components on the structure reliability. Hu (2007) used the average stress to evaluate the effect of failure components on the structure. Zhang and Liu (2007) proposed an energy flow-based evaluation method to evaluate the importance of components.

A generalized structural stiffness-based importance index I, proposed by Ye et al. (2010), was adopted in this work. Both the external load characteristics and stiffness properties were considered in the generalized structural stiffness. The importance indices of the structural components can therefore be measured by the change in the generalized structural stiffness upon damage of a component. The simplified expression is given as follows:

(1)

where K0 and Kf are the generalized structural stiffnesses before and after a component is damaged, respectively and U0 and Uf are the total strain energies of the undamaged and damaged structures, respectively. In a linear elastic model, U0 and Uf are much easier to calculate than K0 and Kf. Therefore, the second part of the equation is considered.

The importance indices proposed by Ye et al. (2010) are suitable for structures consisting of 1D beam elements. However, the stone arch bridge considered here was simulated as a 3D continuum model. It should be noted that the importance indices of structural components evaluated by Eq. (1) are influenced by the element sizes. For example, a region with high importance indices may be predicted to have a low value by Eq. (1) if this region is meshed with very small elements. However, importance indices in the uncritical regions may be inappropriately amplified due to large element sizes. Accordingly, Eq. (1) was modified to Eq. (2) in an attempt to eliminate the element size effect on the importance indices, which was achieved by dividing I in Eq. (1) by the corresponding elemental volume V.

(2)

The following procedure is thus proposed to evaluate the importance indices of structural components of a stone arch bridge:

1.         Establish the FE model of the stone arch bridge by an FE program (MSC.Marc, etc.). Assign corresponding material and geometric properties to the different elements.

2.         Calculate the total strain energy of the original structure under a gravity load via linear elastic computation.

3.         Remove one element from the structure to replicate the initiation of damage. Calculate the total strain energy of the damaged structure and the volume of the removed element.

4.         Calculate the importance index of the removed component using Eq. (2).

5.         Repeat Step 3 and Step 4 for all elements in the structure.

6.         Rank the importance indices of all elements in a descending order. In this study, regions of elements whose accumulative volume is in the first 10% of the total volume are defined as the critical regions of the stone arch bridge.

The importance indices of all the elements evaluated using the aforementioned method are detailed in Fig. 7 and Fig. 8 for the entire structure and the local regions, respectively. It can be observed from the figures that the importance indices at the top of piers and the skewbacks of the primary arch are much larger than those in the other locations.

Fig. 7. Distribution of importance indices in the whole structure

Fig. 7. Distribution of importance indices in the whole structure

(a) Around the top of pier

(a) Around the top of pier

Fig. 8. Distribution of importance indices in the local regions

(b) Around the abutment

Fig. 8. Distribution of importance indices in the local regions

Following the above steps, the elements with an accumulative volume in the first and last 10% of the total volume were identified. Figure 9 highlights the regions where the accumulative volume is in the first and last 10% of the total volume. Elements with an accumulative volume in the first 10% were primarily distributed in the following five regions: the top of the piers; the skewbacks of the primary arches; the upper and lower surfaces of the arch within the quarter span adjacent to the piers; the skewbacks of the spandrel arches; the junctions between the transverse walls and the primary arches. Clearly, these regions are most critical in a stone arch bridge, which can be verified by practical engineering experience. Special attention is thus required in the design, construction and maintenance phases of these critical regions. The regions in the last 10% of the total volume, i.e., the middle regions of the primary arches and the fillers, as shown in Fig. 9, correspond to the lowest importance indices.

Fig. 9. Regions of accumulative volume in the first and last 10%

Fig. 9. Regions of accumulative volume in the first and last 10%

To verify the rationality and correctness of the critical regions determined by the proposed importance assessment method, the following four structural models were analyzed using the pushdown analysis technique.

1.         The original structure (Structure I);

2.         The material strengths of the structure in the most critical regions strengthened by 20% (Structure II);

3.         The material strengths of the structure in the least critical regions strengthened by 20% (Structure III);

4.         The material strengths of the structure in the most critical regions reduced by 20% (Structure IV).

In the pushdown analysis, a gravity load on the bridge was increased proportionally until the structure collapsed. Both material and geometric nonlinearities were considered in the pushdown analysis. The material model remained identical as the previous FE simulation of a stone arch bridge. The ultimate load capacities of the four different structural models are presented in Figure 10.

Fig. 10. Ultimate load capacities of different structural models

Fig. 10. Ultimate load capacities of different structural models

Figure 10 indicates that the ultimate load capacity of the original structure (Structure I) was approximately 3.94 times its own weight. Upon strengthening the materials in the most critical regions, the ultimate load capacity of Structure II increased significantly to approximately 4.70 times its weight. Conversely, when the materials at the least critical regions were strengthened, the ultimate load capacity of Structure III remained essentially identical to that of the original structure. However, when the material strengths of the most critical regions were reduced, the ultimate load capacity decreased to 3.16 times its weight. These results imply that the ultimate load capacity of the structure is extremely sensitive to the material strength of the critical regions. This outcome further confirms that the critical regions identified are reasonable and reliable.

Conclusions

Based on the 
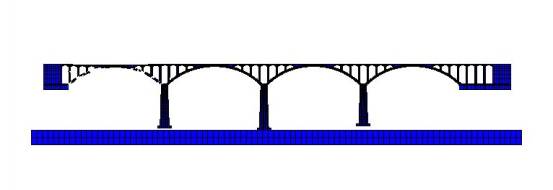
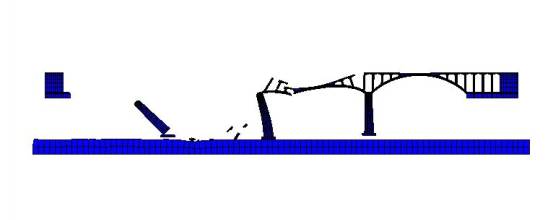
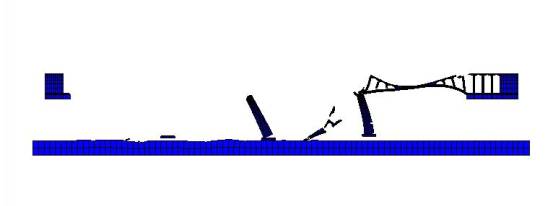
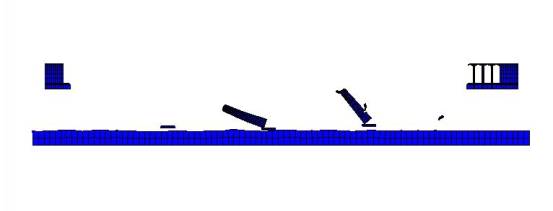
FE simulation of the progressive collapse of a typical stone arch bridge, this study replicated the collapse process and evaluated the importance indices of all the structural elements. The following conclusions can be drawn:

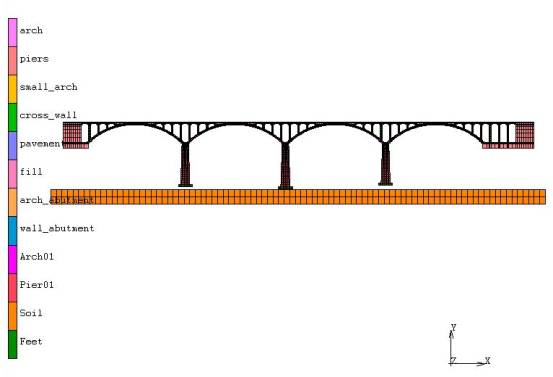
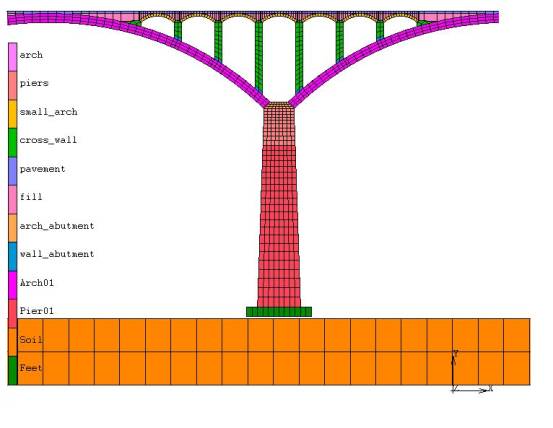
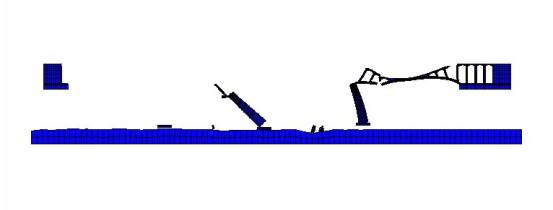
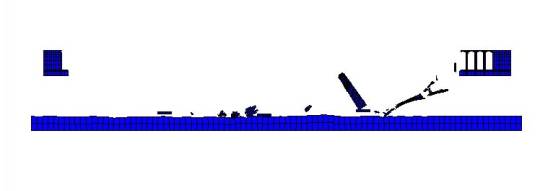
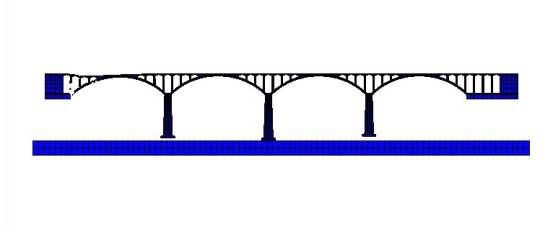
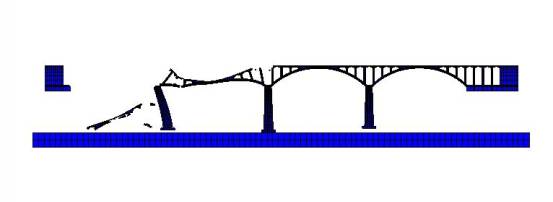
1.         An effective FE simulation of the complete progressive-collapse process of a stone arch bridge was performed;

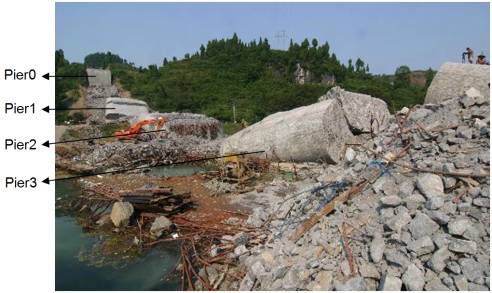
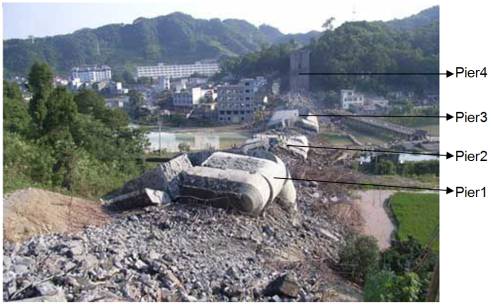
2.         The FE simulation of the stone arch bridge collapse agreed well with the site investigation of the accident, which provides favorable references to determine the possible reasons for the collapse;

3.         A reliable and simple identification method of the critical regions based on the generalized structural stiffness was proposed. The identified critical regions of a stone arch bridge can be used to facilitate a rational design, construction, inspection and maintenance practice, which would thereby lead to prevention strategies and minimize the likelihood of progressive collapses of arch bridges.

Acknowledgements

This study is funded by the West Transport Project of Ministry of Transport of China (Grant No. 2008-318-223-43), Major S&T Special Project of Ministry of Transport of PR China (Grant No. 2011-318-223-170), Tsinghua University Research Funds (Grant No. 2010THZ02-1), and Program for New Century Excellent Talents in University (Grant No. NCET-10-0528).

References

Agarwal, J., Blockley, D. and Woodman N. (2001). ¡°Vulnerability of 3-dimensional trusses.¡± Struct. Safety, 23(3), 203-220.

Baylot, J. T. (1997). ¡°Numerical simulation of alternate scenario for Khobar Towers.¡± Proc., 68th Shock and Vibration Symposium (Limited Distribution), Hunt Valley, MD.

Bažant, Z. P. and Planas, J. (1997). Fracture and size effect in concrete and other quasibrittle materials, CRC Press, Boca Raton.

Biezma, M. V. and Schanack, F. (2007). ¡°Collapse of steel bridges.¡± J. Perform. Constr. Facil., 21(5), 398-405.

Cavicchi, A. and Gambarotta, L. (2005). ¡°Collapse analysis of masonry bridges taking into account arch¨Cfill interaction.¡± Engineering Structures, 27(4), 605-615.

Chen, M. X. (2008). ¡°On stone arch bridge from the Dixi bridge accident in fenghuang.¡± Highway Engineering, 33(3), 1-9 (in Chinese).

Drosopoulos, G. A., Stavroulakis, G. E. and Massalas, C. V. (2006). ¡°Limit analysis of a single span masonry bridge with unilateral frictional contact interfaces.¡± Engineering Structures, 28(13), 1864-1873.

Fanning, P. J. and Boothby, T. E. (2001). ¡°Three-dimensional modeling and full-scale testing of stone arch bridges.¡± Computers & Structures, 79(29-30), 2645-2662.

Farrar, C. R. and Jauregui, D. A. (1998). ¡°Comparative study of damage identification algorithms applied to a bridge: I. Experiment.¡± Smart Mater. Struct., 7(5),704-719.

Gharaibeh, E. S., Frangopol, D. M. and Onoufriou, T. (2002). ¡°Reliability-based importance assessment of structural members with applications to complex structures.¡± Computers & Structures, 80(12), 1113-1131.

Heyman, J. (1969). ¡°The safety of masonry arches.¡± International Journal of Mechanical Sciences, 11(4), 363-385.

Heyman, J. (1993). ¡°The collapse of stone vaulting.¡± Proc., 3th Int. Conf. on Structural Studies, Repairs and Maintenance of Historical Buildings, Computational Mechanics Publications, Bath, UK, 327-338.

Hu, X. B. (2007). ¡°Studies on the progressive-collapse resistant behavior of the new type polyhedral space frame.¡± Ph.D. thesis, Tsinghua University, Beijing, China (in Chinese).

Isobe, D. and Tsuda, M. (2003). ¡°Seismic collapse analysis of reinforced concrete framed structures using the finite element method.¡± Earthquake Engineering & Structural Dynamics, 32(13), 2027-2046.

Ji, Z. Y. and Lin, S. P. (1995). ¡°Fuzzy evaluation for residual carrying capacity of damaged structures.¡± Journal of Building Structure, 16 (2), 51-57 (in Chinese).

Jiang, J. J., Lu, X. Z. and Ye, L. P. (2005). Finite element analysis of concrete structures, Tsinghua University Press. Beijing, China (in Chinese).

Kaewkulchai, G. and Williamson, E. B. (2004). ¡°Beam element formulation and solution procedure for dynamic progressive collapse analysis¡±. Computers & Structures, 82(7-8), 639-651.

Karapitta, L., Mouzakis, H. and Carydis P. (2010). ¡°Explicit finite-element analysis for the in-plane cyclic behavior of unreinforced masonry structures.¡± Earthquake Engineering & Structural Dynamics, 40(2), 175-193.

Khandelwal, K. (2008). ¡°Multi-scale computational simulation of progressive collapse of steel frames.¡± P.h.D. Thesis, University of Michigan, Michigan, USA.

Krauthammer, T., Hall, R. L., Woodson, S. C., Baylot, J. T., Hayes, J. R., and Sohn, Y.(2002). ¡°Development of progressive-collapse analysis procedure and condition assessment for structures.¡± National Workshop on Prevention of Progressive-collapse in Rosemont, Washington, D.C.

Kumar, P. and Bhandari, N. M. (2005). ¡°Non-linear finite element analysis of masonry arches for prediction of collapse load.¡± Structural Engineering International, 15(3), 166-175.

LeBeau, K. H. and Wadia-Fascetti, S. J. (2007). ¡°Fault tree analysis of schoharie creek bridge collapse.¡± J. Perform. Constr. Facil., 21(4), 320-326.

Liu, C. M. and Liu, X. L. (2004). ¡°Study on the comprehensive assessment method of structural reliability.¡± Sichuan Building Science, 30(4), 46-58 (in Chinese).

Liu, C. M. and Liu, X. L. (2005). ¡°Stiffness-based evaluation of component importance and its relationship with redundancy.¡± Journal of Shanghai Jiaotong University, 39(5), 746-750 (in Chinese).

Lofti, H. R. and Shing, P. B. (1994). ¡°Interface model applied to fracture of masonry structures.¡± J. Struct. Eng., 120(1), 63-80.

Long, H. T. (2007). ¡°News: 64 people died in collapse accident of Fenghuang bridge.¡±<http://www.hn.xinhuanet.com/jdwt/2007-08/20/content_10902812.htm> (Aug. 4, 2010) (in Chinese).

Loo, Y. C. and Yang, Y. (1991). ¡°Cracking and failure analysis of masonry arch bridges.¡± J. Struct. Eng., 117(6), 1641-1659.

Lu, X., Lu, X. Z., Zhang, W. K. and Ye, L. P. (2011). ¡°Collapse simulation of a super high-rise building subjected to extremely strong earthquakes.¡± Science China Technological Sciences, 54(10), 2549-2560.

Lu, X. Z., Lin, X. C. and Ye, L. P. (2009). ¡°Simulation of structural collapse with coupled finite element-discrete element method.¡± Proc., Computational Structural Engineering, Shanghai, 127-135.

Lynn, K. M. and Isobe, D. (2007a). ¡°Structural collapse analysis of framed structures under impact loads using ASI-Gauss finite element method.¡± International Journal of Impact Engineer, 34(9), 1500-1516.

Lynn, K. M. and Isobe, D. (2007b). ¡°Finite element code for impact collapse problems of framed structures.¡± International Journal for Numerical Methods in Engineering, 69(12), 2538-2563.

Mattern, S., Blankenhorn, G. and Breidt, M. (2007). ¡°Comparison of building collapse simulation results from finite element and rigid body models.¡± IUTAM Symposium on Multiscale Problems in Multibody System Contacts, Springer, Netherlands, 257-267.

Ministry of Transport of the People¡¯s Republic of China (MTPRC). (2005). Code for design of highway masonry bridge and culverts, China Communications Press, Beijing (in Chinese).

Ministry of Transport of the People¡¯s Republic of China (MTPRC). (2007). Code for design of ground base and foundation of highway bridge and culverts, China Communications Press, Beijing (in Chinese).

MSC.Marc. (2005a). Marc user¡¯s guide, Santa Ana, California.

MSC.Marc. (2005b).Volume D: User subroutines and special routines, Santa Ana, California.

MSC.Marc. (2005c). Volume A: Theory and user information, Santa Ana, California.

Munjiza, A., Bangash, T. and John, N. W. M. (2004). ¡°The combined finite-discrete element method for structural failure and collapse.¡± Engineering Fracture Mechanics, 71(4-6), 469-483.

Nafday, A. M. (2008). ¡°System safety performance metrics for skeletal structures.¡± J. Struct. Eng., 134(3), 499-504.

National Institute of Standards and Technology (NIST). (2008). ¡°Final report on the collapse of world trade centre building 7.¡± <http:// wtc.nist.gov/media/NIST_NCSTAR_1A_for_public_comment.pdf> (Aug. 8, 2010).

National Transportation Safety Board (NTSB). (2008). ¡°Highway accident report: collapse of interstate 35W highway bridge.¡± < http://www.ntsb.gov/publictn/2008/HAR0803.pdf> (May 7, 2010)

Pekau, O. A. and Cui, Y. (2006). ¡°Progressive collapse simulation of precast panel shear walls during earthquakes.¡± Computers & Structures, 84(5-6), 400-412.

Poston, R. W. and West, J. S. (2005). ¡°Investigation of the charlotte motor speedway bridge collapse.¡± Proc., 2005 Structures Congress and the 2005 Forensic Engineering Symposium, ASCE, New York.

Rots, J. G. (1991). ¡°Numerical simulation of cracking in structural masonry.¡± Heron 1991, 36(2), 49-63.

Scheer, J. (2000). Versagen von Bauwerken (Band 1: Br¨¨cken). Ernst & Sohn, Berlin.

Scott, W. R. (1995). ¡°Reconstruction of the flood damaged Ness viaduct ¨C Inverness.¡± Institution of Civil Engineers, 111(2), 135-137.

Thavalingam, A., Bicanic, N., Robinson J. I. and Ponniah D. A. (2001). ¡°Computational framework for discontinuous modelling of masonry arch bridges.¡± Computers & Structures, 79(19), 1821-1830.

Wardhana, K. and Hadipriono, F. C. (2003). ¡°Analysis of recent bridge failures in the United States.¡± J. Perform. Constr. Facil., 17 (3), 144-150.

Yao, L.S. (2008). Bridge engineering (2nd edition), China Communication Press, Beijing, China (in Chinese).

Ye, L. P., Lin, X. C., Qu, Z., Lu, X. Z. and Pan, P. (2010). ¡°Method of evaluating element importance of structure system based on the generalized structural stiffness.¡± Journal of Architectural and Civil Engineering, 27(1), 1-6 (in Chinese).

Zhang, L. M. and Liu, X. L. (2007). ¡°Network of energy transfer in frame structures and its preliminary application.¡± China Civil Engineering Journal, 2007, 40(3), 45-49 (in Chinese).

Zhang, Y. and Li, L. S. (1997). ¡°Fuzzy comprehensive evaluation of reliability of existing building structures.¡± Journal of Building Structure, 189(5), 12-20 (in Chinese).

Zhou, J. T., Liu, S. M. and Li, Y. J. (2008). Reinforcement and reconstruction of masonry arch bridge, China Communication Press, Beijing (in Chinese).

Table 1. Material Parameters of Different Structural Components

Structural components

Young¡¯s modulus (MPa)

Yielding strength (MPa)

Cracking strength (MPa)

Poisson ratio

Density (kg/m3)

Primary arch

13,293

10.13

0.32

0.20

2500

Transverse wall

7,300

5.25

0.13

0.20

2500

Spandrel arch

7,300

6.30

0.13

0.20

2500

Pier

11,256

8.58

0.28

0.20

2400

Foundation

25,500

13.40

1.54

0.20

2000

Filler

7,300

1.12

0.11

0.20

2300

Pavement

30,000

20.10

2.01

0.20

2500


[1] Doctoral Candidate, Department of Civil Engineering, Tsinghua University, Beijing 100084, China.

[2] Associate Professor, Department of Civil Engineering, Tsinghua University, Beijing 100084, China (corresponding author).Email: luxz@tsinghua.edu.cn.

[3] Associate Professor, Griffith School of Engineering, Griffith University Gold Coast Campus, Queensland 4222, Australia.

[4] Doctoral Candidate, Department of Civil Engineering, Tsinghua University, Beijing 100084, China.

[5] Professor, Department of Civil Engineering, Tsinghua University, Beijing 100084, China.

Introduction
Research
Application
Teaching
Publications
Download
Issues
Others


Our Lab

Collapse Prevention Committee