4 Collapse mechanisms of the specimens
In this section, the material strain development
at Sections A to I during the entire collapse process is analyzed to explore
the collapse-resistant mechanisms. In the subsequent analysis, BB and BT represent
the bottom and top reinforcements in the beams, respectively; SB and ST represent
the bottom and top reinforcements in the slab, respectively; CH represents
the longitudinal strain of concrete at the half height of the beams. The number
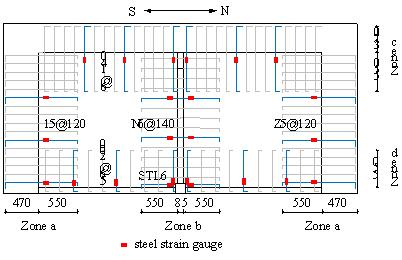
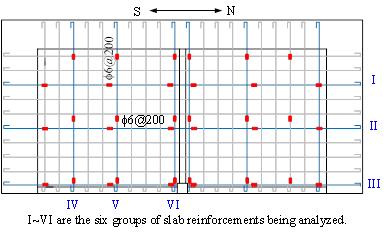
and position of the strain gauges in the slab are shown in Figure 5. The tensile
and compressive strains are defined
as positive and negative, respectively, in the following analyses. To
clearly illustrate the relationship between the material strain and structural
resistance, the load-displacement responses of the specimens (represented
by the gray lines) are also presented along with the strain development.
The strains of beam reinforcement at Section
A of BE1 and SE1 are shown in Figure 12. It can be found that under the beam
mechanism: (1) Before the displacement exceeded Db, the
compressive strain of BB in SE1 was greater than that in BE1 while the tensile
strain of BT was smaller. This is because the slab reinforcement was also
in tension and resulted in a higher tensile reinforcement ratio at this section.
(2) After the displacement exceeded Db, the strain of BB
in SE1 continued to grow until the rebar buckled due to compression. In contrast,
the strain of BB in BE1 had a smaller strain and the buckling of the rebar
was not observed in the test.
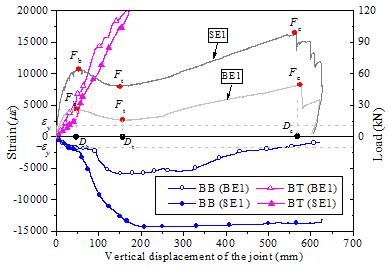
Figure 12 Reinforcement strains at Section A of BE1 and
SE1
Under the beam mechanism, the compressive
strain distributed throughout the height of Section B in both SE1 and BE1
(see Figure 13), which indicated the existence of the axial compressive force
and confirmed the CAA in the X-beams. The compressive strains reached their
maximum values near the peak point of the beam mechanism (i.e., Db).
Afterwards, the compressive strains decreased gradually and changed to tensile
strains and eventually the specimens were under the catenary mechanism.
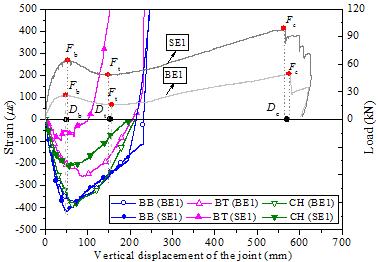
Figure 13 Reinforcement strains
at Section B of BE1 and SE1
The reinforcement strains at Section C of BE1 and SE1
are shown in Figure 14. STL6 represents the strain of ST at the location as
shown in Figure 5. Under the beam mechanism, BT and BB in BE1 were in compression
and tension, respectively, which indicated that the height of compressive
zone was greater than as (i.e., the distance between the
center of the beam top rebars and the upper surface of the beam). In contrast,
both BT and BB in SE1 were in tension and only ST was in compression, indicating
that the height of compressive zone was smaller than as.
The slab led to a larger compressive reinforcement ratio at Section C and
also worked as a flange which increased the width of the concrete compressive
zone. As a result, the height of compressive zone at Section C of SE1 was
smaller than that of BE1. At the same time, a smaller height of the compressive
zone resulted of a larger distance between the tensile reinforcement and the
neutral axis, making the increase of the tensile strains of the bottom rebars
in SE1 much faster than those in BE1. Under the catenary mechanism, BT in
BE1 and ST in SE1 changed from compression to tension by which the entire
Section C was in tension. When the load-displacement curves reached the peak
point of the catenary mechanism (Dc), the beam reinforcement
strains were much larger than the yield strain, indicating that the rebars
in the beams contributed significantly to the collapse resistance of the specimens.
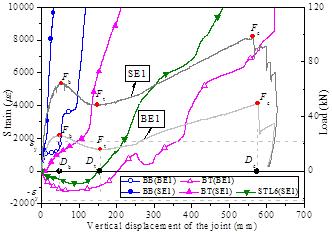
Figure 14 Reinforcement strains at Section C of BE1 and
SE1
During the collapse process, the behavior of the X-beams
in BE1 can be concluded as follows: (1) Under the beam mechanism, the flexural
strengths of beam ends (i.e., Sections A, C, D and F) contributed considerably
to the progressive collapse resistance. Significant axial forces were also
developed in the beams. As a result, the CAA in the beams also contributed
to the progressive collapse resistance. (2) Under the catenary mechanism,
the beam ends lost their flexural strengths, the axial force transformed from
compression to tension and the tensile cracks distributed throughout the entire
beam. Therefore, concrete lost its bearing capacity and the external load
was resisted by the continuous reinforcement in the X-beams through the catenary
action.
4.1.2 X-direction slabs
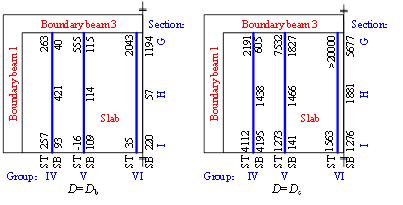
In order to further investigate the interaction of the
X-beams and slabs of SE1 in resisting progressive collapse, the strains of
the X-direction ST and SB at the peak displacements of the beam mechanism
(i.e., Db) and the catenary mechanism (i.e., Dc)
are given in Figure 15. The locations of the six groups of slab reinforcements
(i.e., Group I-VI) are given in Figure 5b. Due to
symmetry, only the reinforcement strains on the south side of the slab (left
slab, Figure 2) are presented herein. As the measuring range of the steel
strain gauge was 20,000 me, the strain values of Group III exceeding such a measuring range are not presented in the figure.
It can be seen from the figure that:
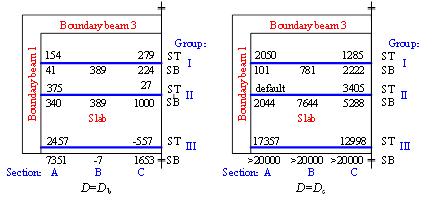
Note: ST and SB are the top and bottom reinforcement in the slab, respectively.
Figure 15 Strains of the X-direction reinforcements in the slab of SE1 (unit: me)
(1) Under the beam mechanism, ST and SB were in tension at Section A, suggesting that the
compressive zone at this section was only located in the bottom area of the
beams. At Section C, only the top reinforcement of Group
III was in compression whilst the other reinforcement, i.e., the slab bottom
reinforcement of Group III and all reinforcement of Groups I
and II, were in tension. This indicates that the compressive zone at Section
C was mainly located at the top of X-beam and the part of slab close to the
free edge. Hence, the compressive force transferring path of CAA in the X-direction
of beam-slab substructure can be illustrated as Figure 16. The force was transferred
from a certain range of the top area of the slab at Section C to the bottom
area of the X-beam at Section A.
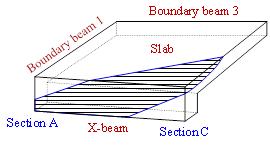
Figure 16 Compressive stress path of CAA in the beam
mechanism of SE1
(2) Under the catenary mechanism, all reinforcement in the
slab were in tension, among which the reinforcement within 2/3 width of the
slab from the free edge yielded. The closer to the free edge, the larger the
reinforcement strains were. Consequently, the portion of the slab close to
the free edge contributed the most to the structural resistance under the
catenary mechanism.
It can be concluded that the floor system of
SE1 in the X-direction exhibited uneven deformation under the
edge-column-removal scenario. This led to the contribution of the slabs to
the collapse resistance, under both the beam and catenary mechanisms, mainly
through the portion close to the free edge where the largest deformation occurred.
4.2 Y-direction collapse-resistant
mechanism
The reinforcement strains at Section G of BE1 and SE1
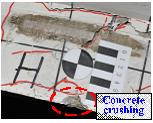
are shown in Figure 17. Under the beam mechanism, the typical over-reinforced
failure mode was also found at this section of SE1, in which BT did not yield
when BB exceeded the concrete crushing strain. This was consistent with the
experimental observation that the concrete in compression seriously crushed
and spalled and the bottom reinforcement buckled. Such over-reinforced failure
mode is a result of the tensile reinforcement ratio being significantly increased
by the Y-direction slab reinforcement. In contrast, BB of BE1 was much smaller
and the beam end exhibited an under-reinforced bending mechanism. The maximum
compressive strain in BB of BE1 under the beam mechanism was only 671 me. After the maximum strain was measured, the strain gauge might
be damaged because of severe concrete crushing.
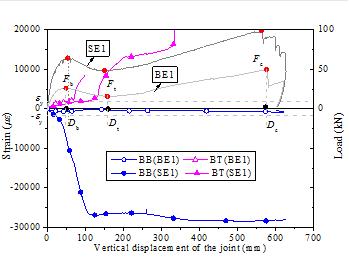
Figure 17 Reinforcement strains at Section G of BE1 and
SE1
It can be found from Figure 18 that BB was in compression
and BT was in tension at Section H of BE1 and SE1 under both the beam and
catenary mechanisms. Such a phenomenon was different from the tension state
of Section B in the X-beams under the large deformation stage, indicating
that the catenary effect was not significant in Y-beam under this stage.
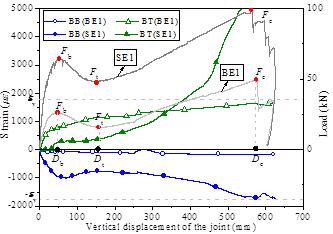
Figure 18 Reinforcement strains at Section H of BE1 and
SE1
It can be seen from Figure 19 that: (1) For BE1 under
the beam mechanism, BB at Section I was in tension whilst BT at Section I
was in compression, indicating a positive bending moment at Section I of the
Y-beam. As was mentioned before, the bending moments at Sections G and H were
negative, meaning that the direction of bending deformation reversed in the
middle of the Y-beam of BE1. Such a conversion was caused by the restraint
at the beam end from the X-beams. The above analysis can be supported by the
crack distribution of the Y-beam of BE1 (Figure 9b), where tensile cracks
propagated from the beam bottom at Section I and the beam top from Sections
G to H. (2) Under the catenary mechanism, BT at Section I of BE1 transformed
from compression to tension. Even though the tensile strain was small, a tensile
force was developed in the Y-beam under the large deformation stage. Note
that the catenary action in the Y-direction was much weaker than that in the
X-direction according to the magnitude of the measured strains. (3) Unlike
BE1, BB in SE1 was in compression and BT was in tension at Section I, indicating
that the bending moment at this section was negative. Thus, all of Sections
G, H and I were under negative bending moment which was different from BE1.
The torsional stiffness of the X-beams provided the flexural restraint on
the Y-beam for BE1. In SE1, although the slabs enhanced the torsional stiffness
of the X-beams, the slabs also induced a much larger flexural stiffness. Hence,
the Y-beam and the slabs of SE1 performed like a cantilever in which the bending
moment kept the same sign.
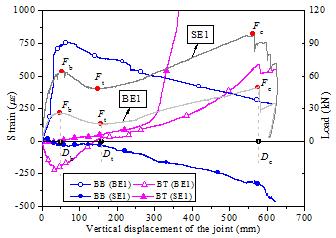
Figure 19 Reinforcement strains at Section I of BE1 and
SE1
The collapse-resistant mechanism of the Y-beam of BE1
can be concluded below: (1) Under the beam mechanism, the bending moment at
Section I could be neglected because the material strains at Section I were
much smaller than those at Section G. Consequently, the Y-beam can be approximately
treated as a cantilever with a concentrated load at the free end. (2) Under
the catenary mechanism, because the residual flexural strength and the tying
force of the beam reinforcement in the Y-beam were considerably smaller compared
to the catenary tensile force in the X-beams, the contribution of the Y-beam
to the collapse resistance can be neglected, too.
4.2.2 Y-direction slabs
The strains of the slab rebars in the Y-direction were
also measured as shown in Figure 20. Due to symmetry, only the strains on
the south side of the slab are presented herein. It can be seen from the figure
that: (1) At the peak load of the beam mechanism, ST and SB at Section G were
in tension. The closer to the Y-beam, the larger reinforcement strains were.
This was because the slabs functioned as the flanges of the Y-beam under the
negative bending moment. All of the reinforcement in the slab was in tension,
indicating that the height of tensile zone was larger than the thickness of
the slab. (2) At the peak load of the catenary mechanism, as the Y-beam was
restrained by the X-beams and the slabs when they deflected downwards, ST
and SB at all sections in the Y-direction were in tension. However, the reinforcement
strains in the Y-direction of the slab were much smaller than those in the
X-direction (see Figure 15).
Note: ST and SB are the top and bottom reinforcement
in the slab, respectively.
Figure 20 Strains of the Y-direction reinforcement in
the slab of SE1 (unit: me)
It can be found that the collapse-resistant mechanisms
of SE1 in the Y-direction are as follows: (1) Under the beam mechanism, the beam-slab substructure in the Y-direction performed
like a cantilever in which the external load was mainly resisted by the flexural
strength. The presence of the slabs led to the over-reinforced failure mode
at Section G. (2) Under the catenary mechanism, the residual flexural strength
and the tying force in the Y-direction of the slabs and the Y-beam were very
small, therefore their contribution to the collapse resistance can be ignored.
5 Effects of various structural parameters on progressive
collapse resistance
The load-displacement curves of all the specimens are
presented in Figure 21. The peak values of their collapse resistances are
listed in Table 6.
Table 6 Collapse resistances of the specimens
| |
Fb/kN
|
Db/mm
|
Ft/kN
|
Dt/mm
|
Fc/kN
|
Dc/mm
|
Fc/ Fb
|
|
SE1
|
64
|
53
|
47
|
151
|
99
|
563
|
1.55
|
|
SE2
|
65
|
53
|
57
|
139
|
82
|
365
|
1.26
|
|
SE3
|
87
|
48
|
51
|
140
|
82
|
406
|
0.94
|
|
SE4
|
76
|
60
|
66
|
142
|
126
|
450
|
1.66
|
|
BE1
|
26
|
48
|
16
|
157
|
50
|
576
|
1.92
|
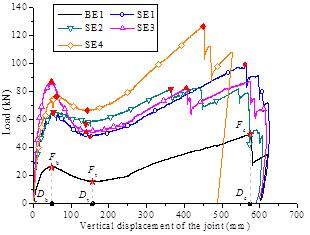
Figure 21 Load-displacement curves of all the specimens
5.1 Effect of the slab
By comparing the results of the beam-slab specimen SE1
and the beam specimen BE1, it can be found that:
(1) The presence of the slabs improved
Fb by 146%. According to the above discussion, Fb
mainly relied on the flexural strengths at the beam ends (i.e., Sections
A, F and G and Sections C and D). At Sections A, F and G, the increased slab
reinforcement improved the tensile reinforcement
and the ultimate flexural strengths. At Sections C and D, both the compressive
reinforcement ratio and the width of the concrete compressive zone were increased,
leading to a much smaller height of the compressive zone when the bottom rebars
yielded. As a result, the lever-arm the tensile force of bottom rebars increased
and resulted in a larger flexural strength of these sections. Consequently,
the beam-slab specimen had a higher collapse resistance under the beam mechanism.
(2) The presence of slabs increased Fc
by 98%. Fc mainly relied on the axial force of the continuous
reinforcement. As the deformation of the slab was unevenly distributed, only
the portion of the reinforcement in the slab near the X-beams (or free edge)
contributed substantial catenary forces to resist the external load. Consequently,
although the amount of the continuous reinforcement in the slab was 2.5 times
that in the beam, the improvement of Fc was far less than
such a scale.
5.2
Effect of the slab thickness
The slab thickness of SE2 was 50% greater than SE1. To
satisfy the requirement of the minimum reinforcement ratio of the slab as
specified in the Chinese Code for the Design of Concrete Structures [40],
the reinforcement was increased by 43% in the slab of SE2. Note that this
arrangement strictly complied with the actual engineering practice. The experimental
results are summarized herein:
(1) Although both the slab thickness and reinforcement were
increased in SE2, Fb of SE2 remained essentially the same
as that of SE1. Fb was contributed by the bending capacities
of the beam ends in two directions and the compressive arch action in the
X-direction only. At Sections A, F and G, over-reinforced failure occurred
in which additional reinforcement in the slabs has little effect on the flexural
capacity. Similarly, at Sections C and D, the additional slab reinforcement
was located in either the compressive zones or the low-tensile-stress zones
as discussed in Section 4.1.2 and in turn contributed little to the flexural
strength. All these factors led to almost unchanged Fb of
SE2 as compared to SE1.
(2) Under the catenary mechanism, Fc
of SE2 was greater than that of SE1 before the rupture of the reinforcement.
Although the slab reinforcement in SE2 was 43% larger than that in SE1, at
the same vertical displacement of 366 mm, the bearing capacity of SE2 was
81 kN, which was only 13% greater than that of SE1 (i.e., 72 kN). Due to the
unevenly distributed reinforcement strains in the slab, only the portion of
the X-direction reinforcement in the slab close to the free edge contributed
significant catenary forces to resist the external load.
5.3 Effect of the beam height
The beam height of SE3 was 18% higher than that of SE1. The amount of
reinforcement in these two specimens remained the same. As the beam height
increased, the heights of the compressive zones and the lever-arms of the
tensile and compressive resultants increased at all beam ends. In consequence,
Fb of SE3 was 36% greater than SE1 under the beam mechanism.
Under the catenary mechanism, the collapse resistance
of SE3 was slightly higher than that of SE1. This is because, under the same
vertical displacement, the strain of SB in SE3 was slightly larger than that
in SE1 due to a larger beam height. Note that SE3 had a larger resistance
of the catenary action than SE1 at the same displacement when D >
Dt (see Figure 21). However, a reinforcing steel bar in
SE3 was found to occasionally rupture leading to a smaller resistance under
the catenary action when the test was terminated.
5.4 Effect of the seismic design
intensity
The design seismic intensity of SE4 was much higher than
that of SE1 according to the Chinese Code for Seismic Design of Buildings
[41]. The PGA of the design earthquake was increased from 0.05g (SE1) to 0.20g
(SE4). The increase in the seismic design intensity resulted in an increase
of the amount of seismic reinforcement in the beam. In contrast, the slab
reinforcement remained the same. It can be found from the experimental results
that:
(1) The tensile reinforcement ratio at Section A was increased
by 116% (from 0.77% for SE1 to 1.69% for SE4). However, due to the over-reinforced
failure at Sections A, F and G, the additional tensile reinforcement had limited
effect on the flexural strength. In contrast, the additional bottom reinforcement
in X-beams at Sections C and D can effectively improve the flexural strength
at these sections. In consequence, the resistance of SE4 was 19% higher than
that of SE1. The resistance was improved more significantly than that by increasing
the slab reinforcement.
(2) Under the catenary mechanism, Fc of
SE4 was significantly higher than that of SE1 at the same vertical displacement.
When the displacement reached 453 mm, Fc of SE4 and SE1
were 125 kN and 84 kN, respectively. Fc mainly relied on
the catenary force from the X-direction reinforcement in the X-beams and the
slabs. Note that the area of the longitudinal reinforcement in the X-beams
of SE4 was 2.78 times that of SE1. Meanwhile, Fc of SE4
only increased by 49% comparing to SE1. This is because the top reinforcement
in the slab near the X-beams also contributed to Fc, and
reduced the effect of change in the beam reinforcement.
|